A/B testing marketing ads on Kaggle data in VS Code: Scripting in Python with scipy, matplotlib, requests, warnings, pandas, seaborn, beautiful soup, Numpy, and more variations with screenshots for clarity.
Exploratory Data Analysis with Python
I performed an A/B test on marketing data obtained from here, using the two-sample t-test, Chi-squared test, Shapiro-Wilk test for normality, Equality of variances assumption check (Levene’s Test), and Mann-Whitney U test.
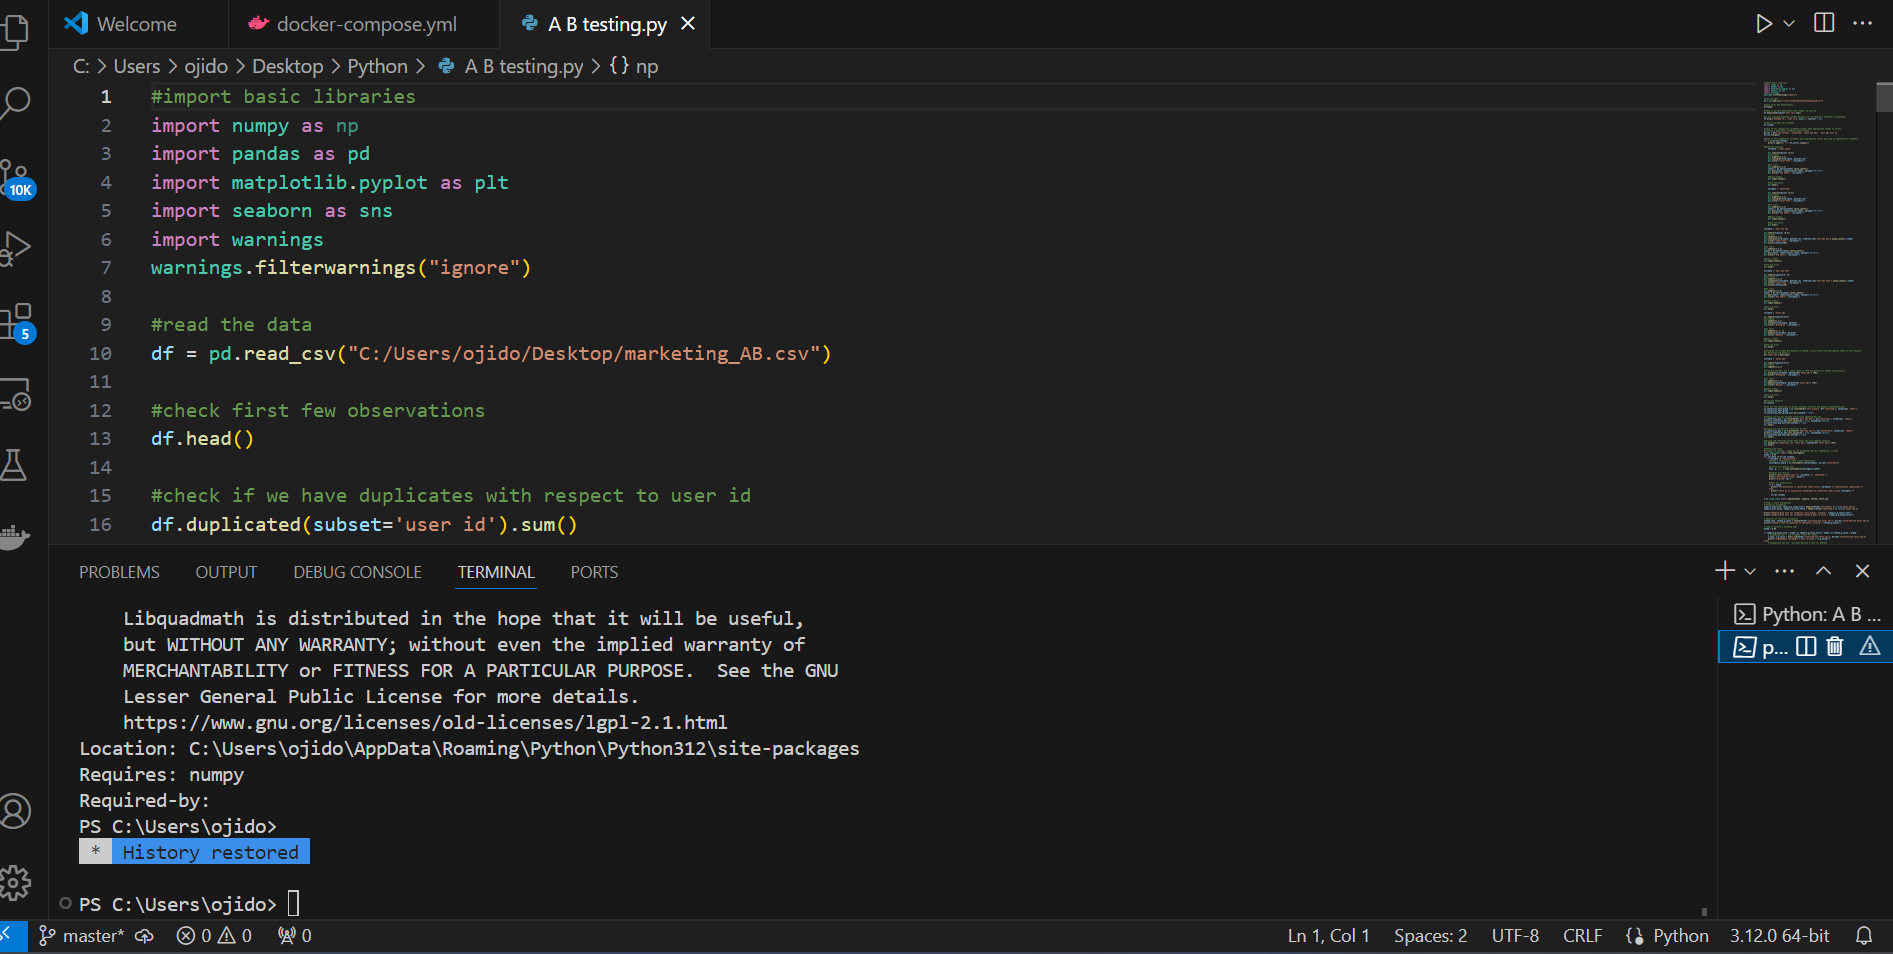
Expert view: Initial code imports Python libraries and loads the CSV data for analysis
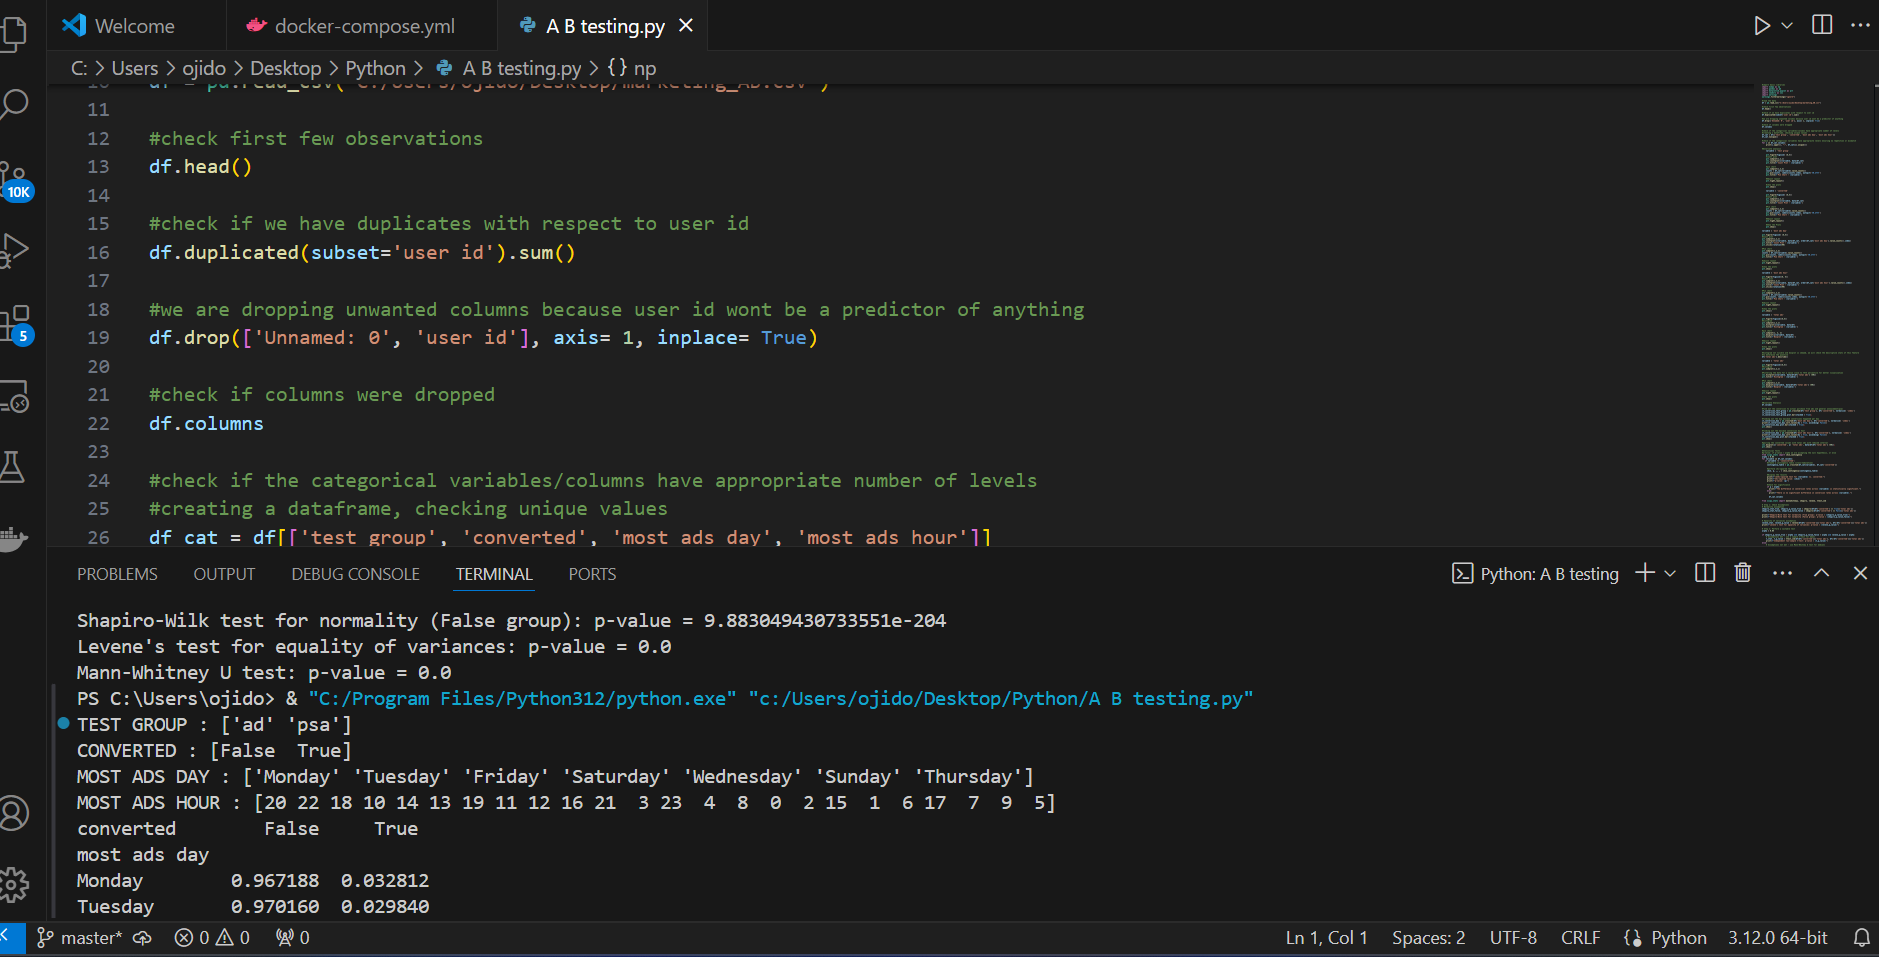
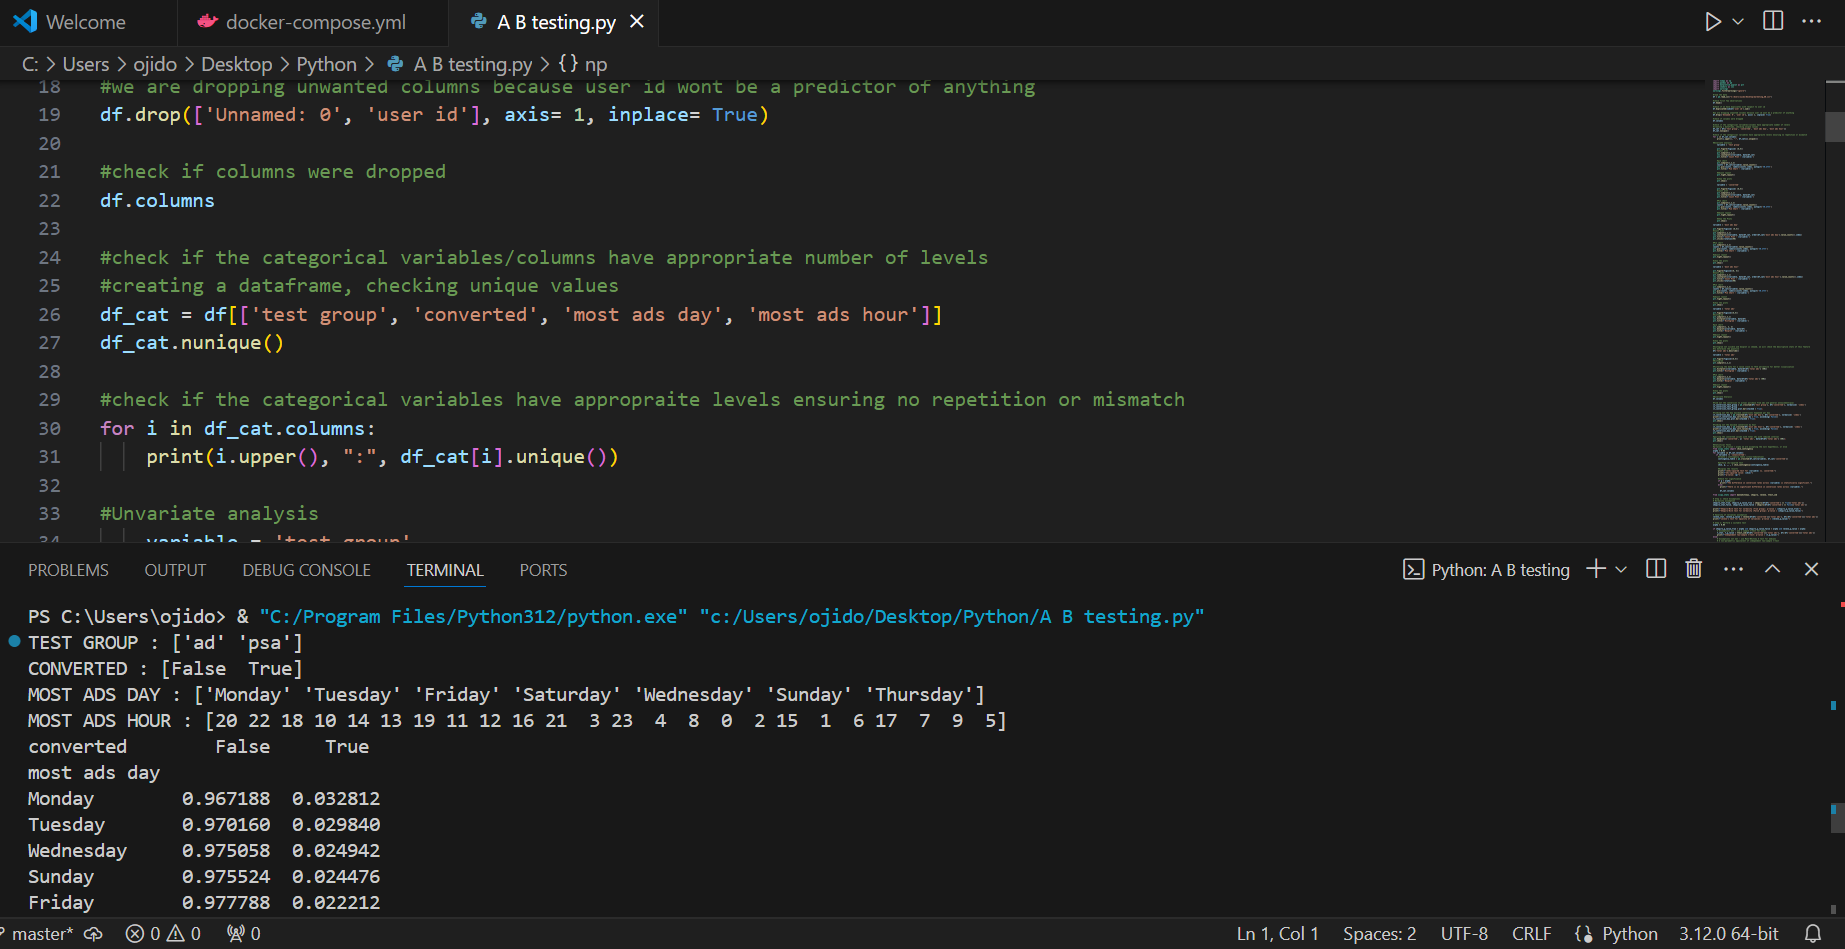
The images below show me dropping unwanted columns that are insignificant to the analysis and creating a data frame, to check for unique values in the remaining columns and also check if the categorical variables/column names have appropriate levels ensuring no repetition or mismatch.
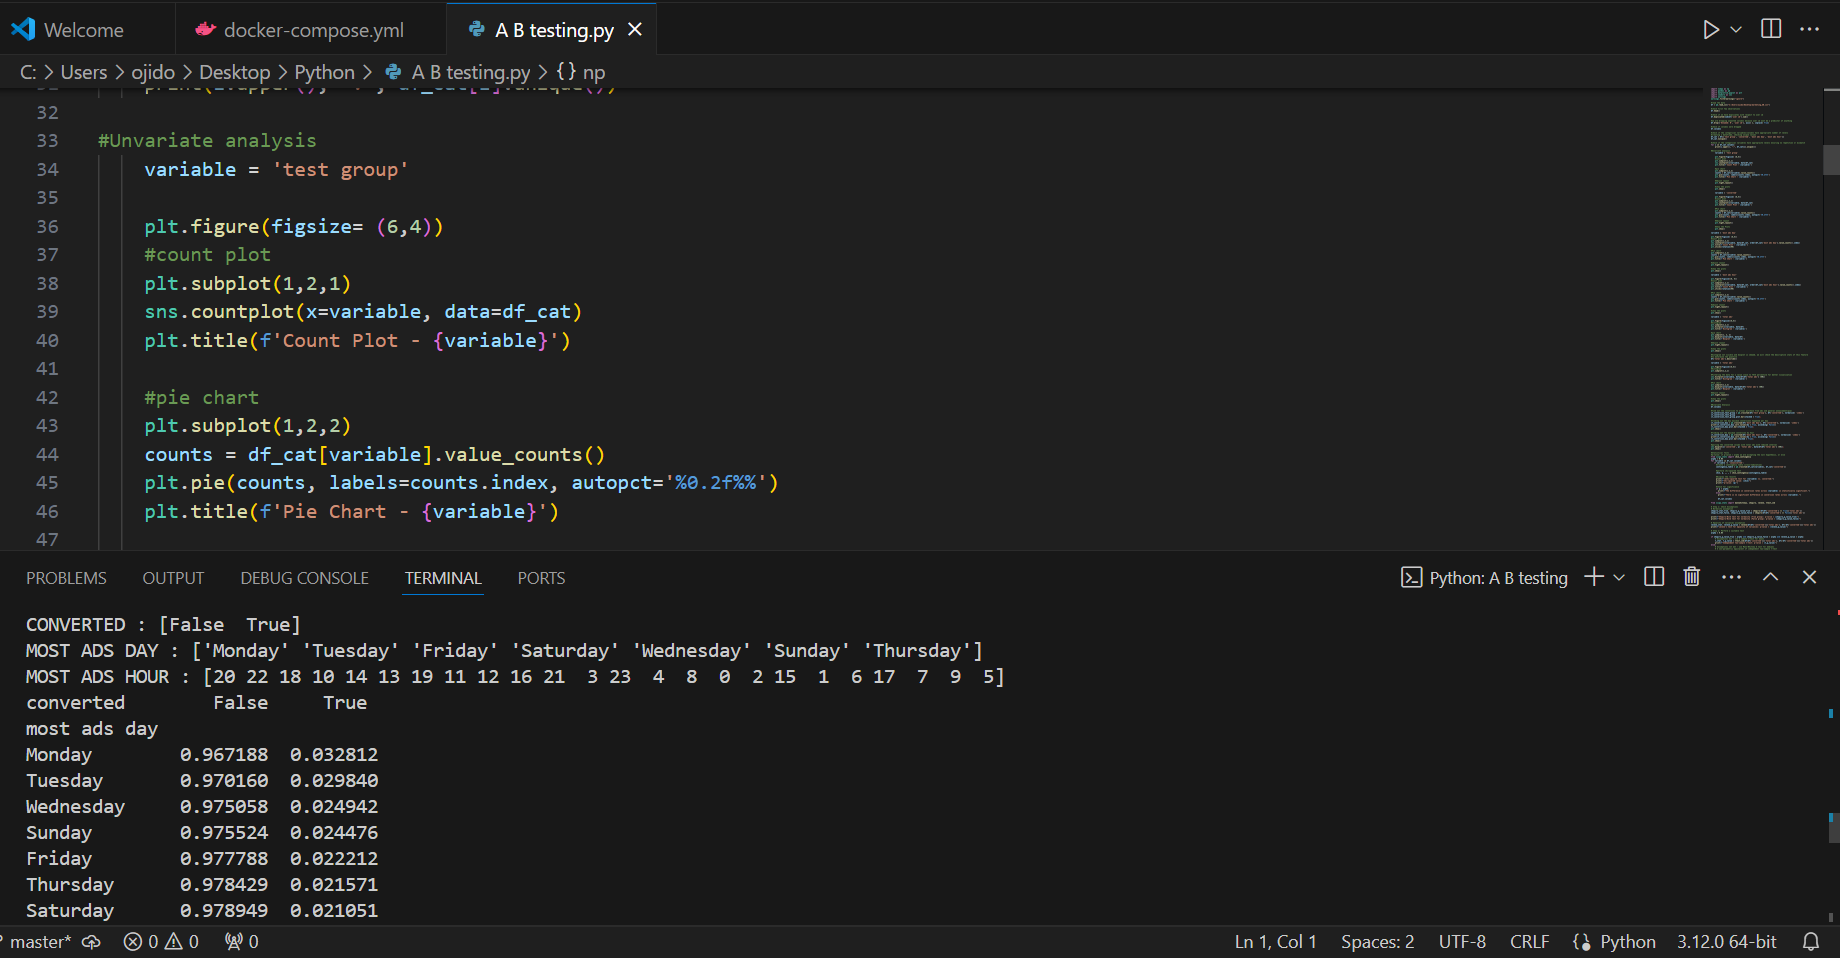
Univariate Analysis
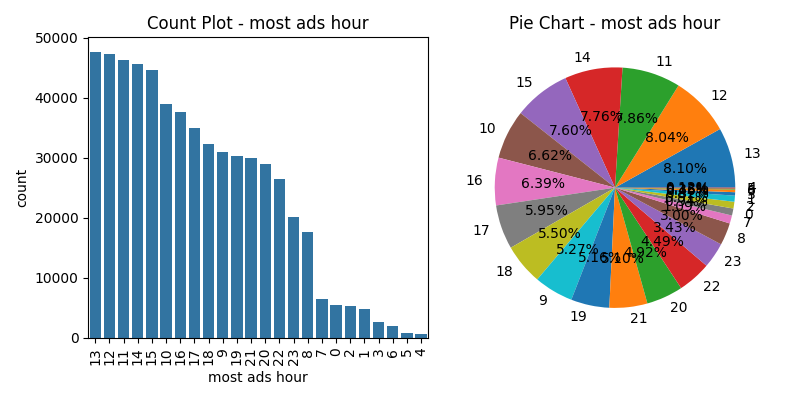
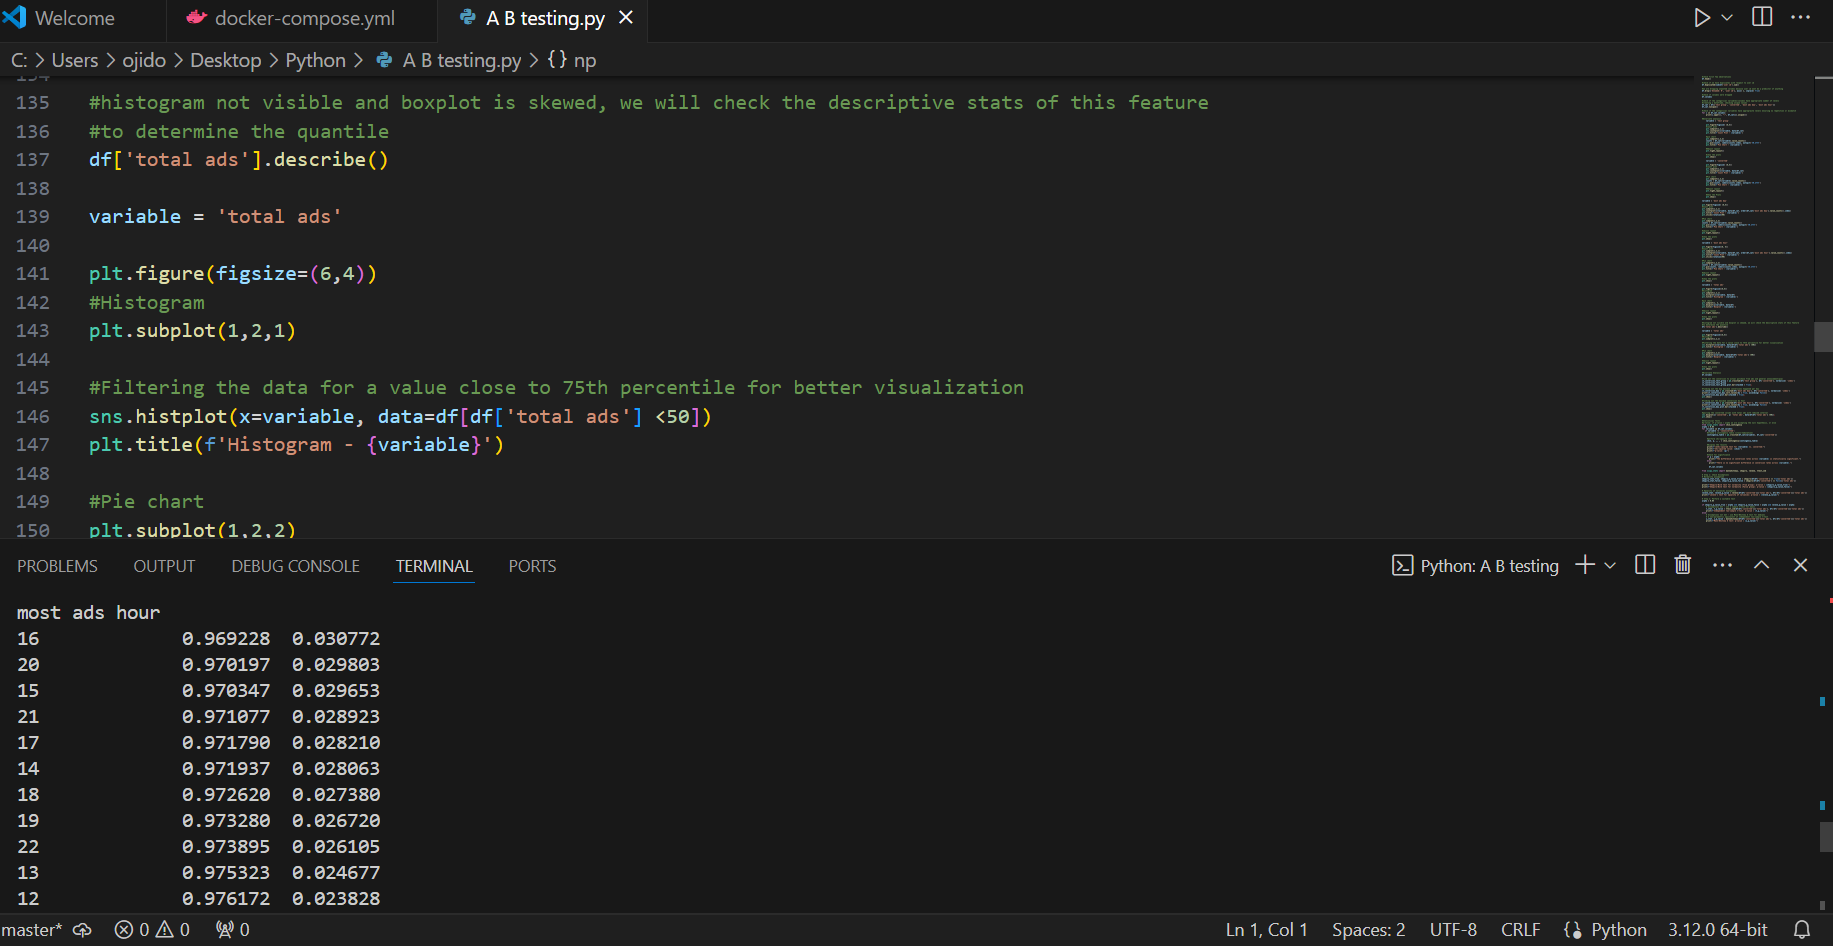
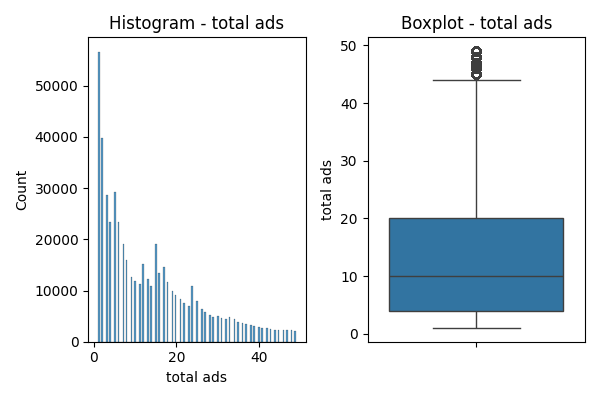
The following visualizations explore the distribution of key variables: test group (Ad vs. PSA), conversion rates, most frequent ad days (Friday, Monday, Sunday), most frequent ad hours (11 AM, 12 PM, 1 PM), and total ad impressions (median).
Key points:
Test group composition is 96% Ads (targeted marketing) and 4% PSAs (general announcements), with respective conversion rates displayed.
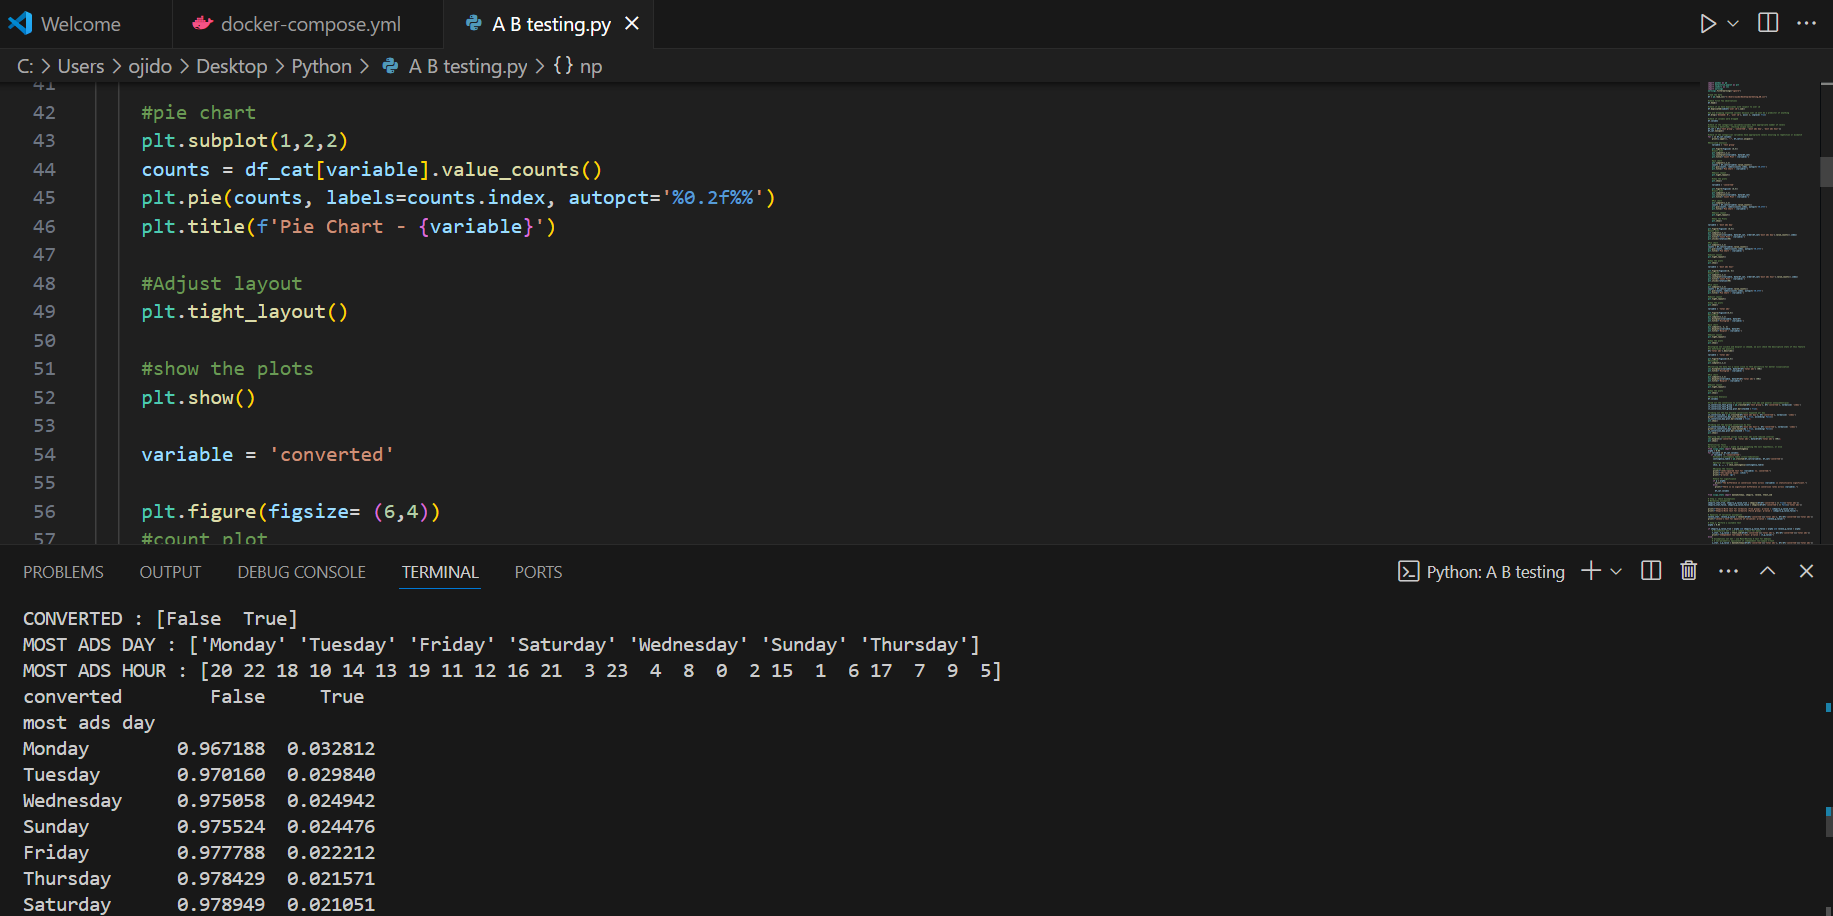
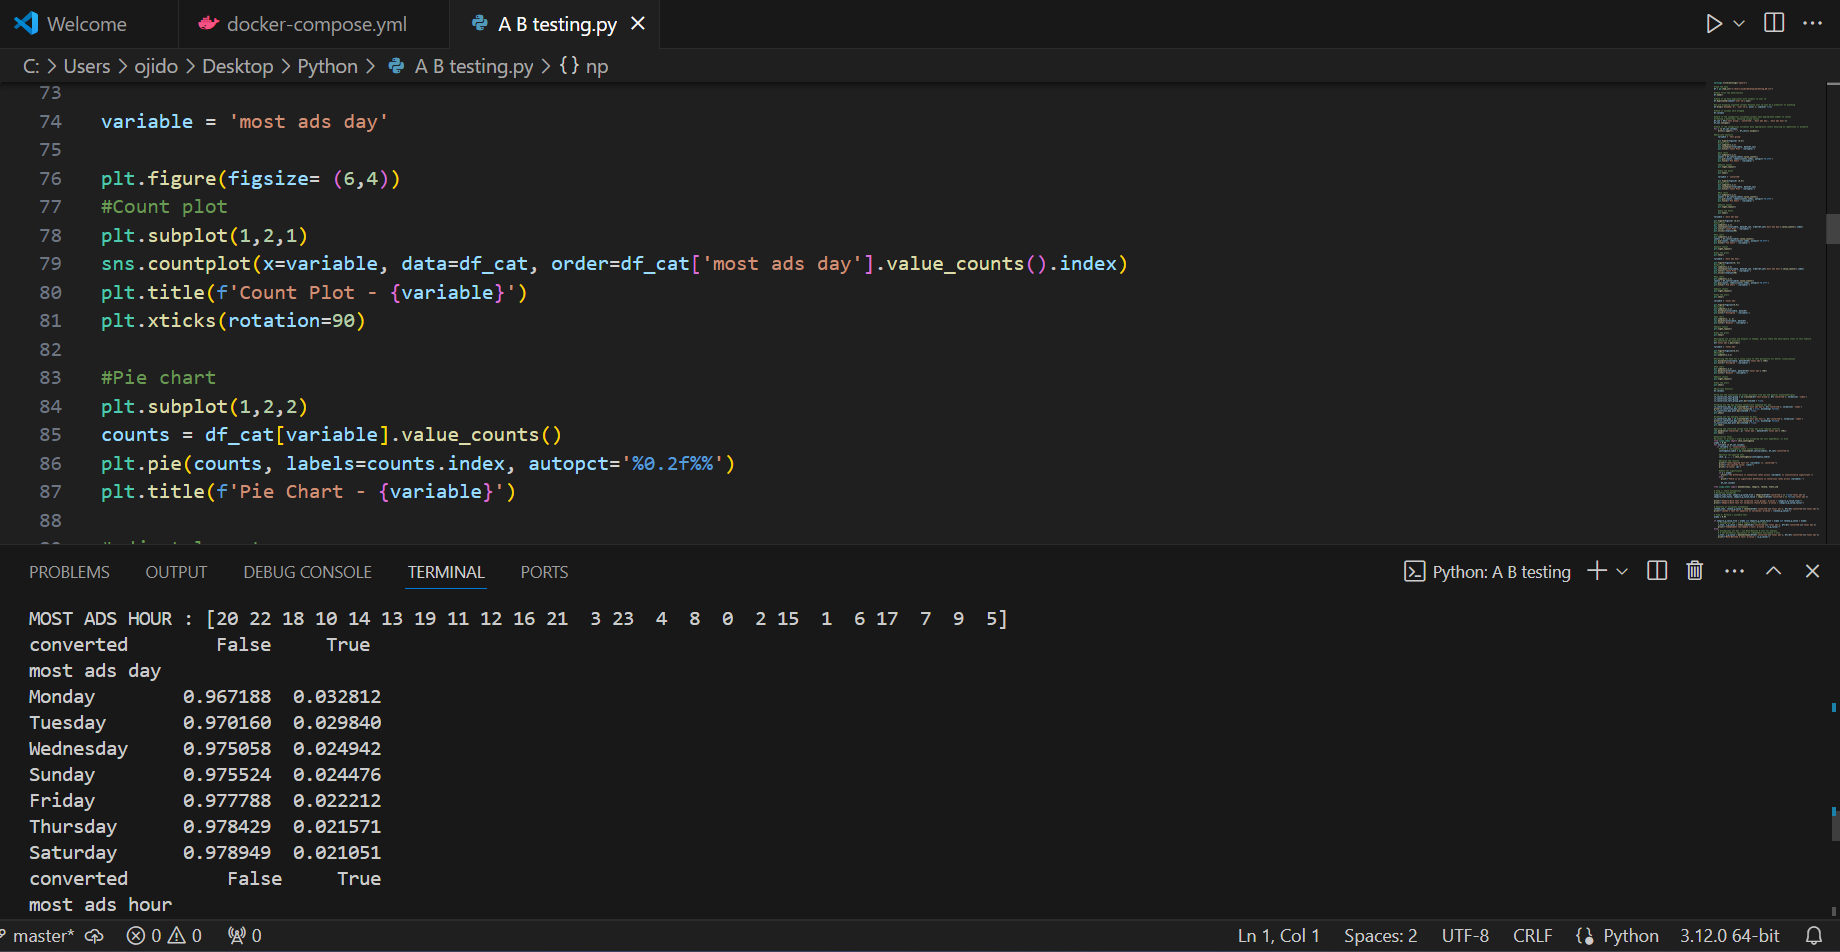
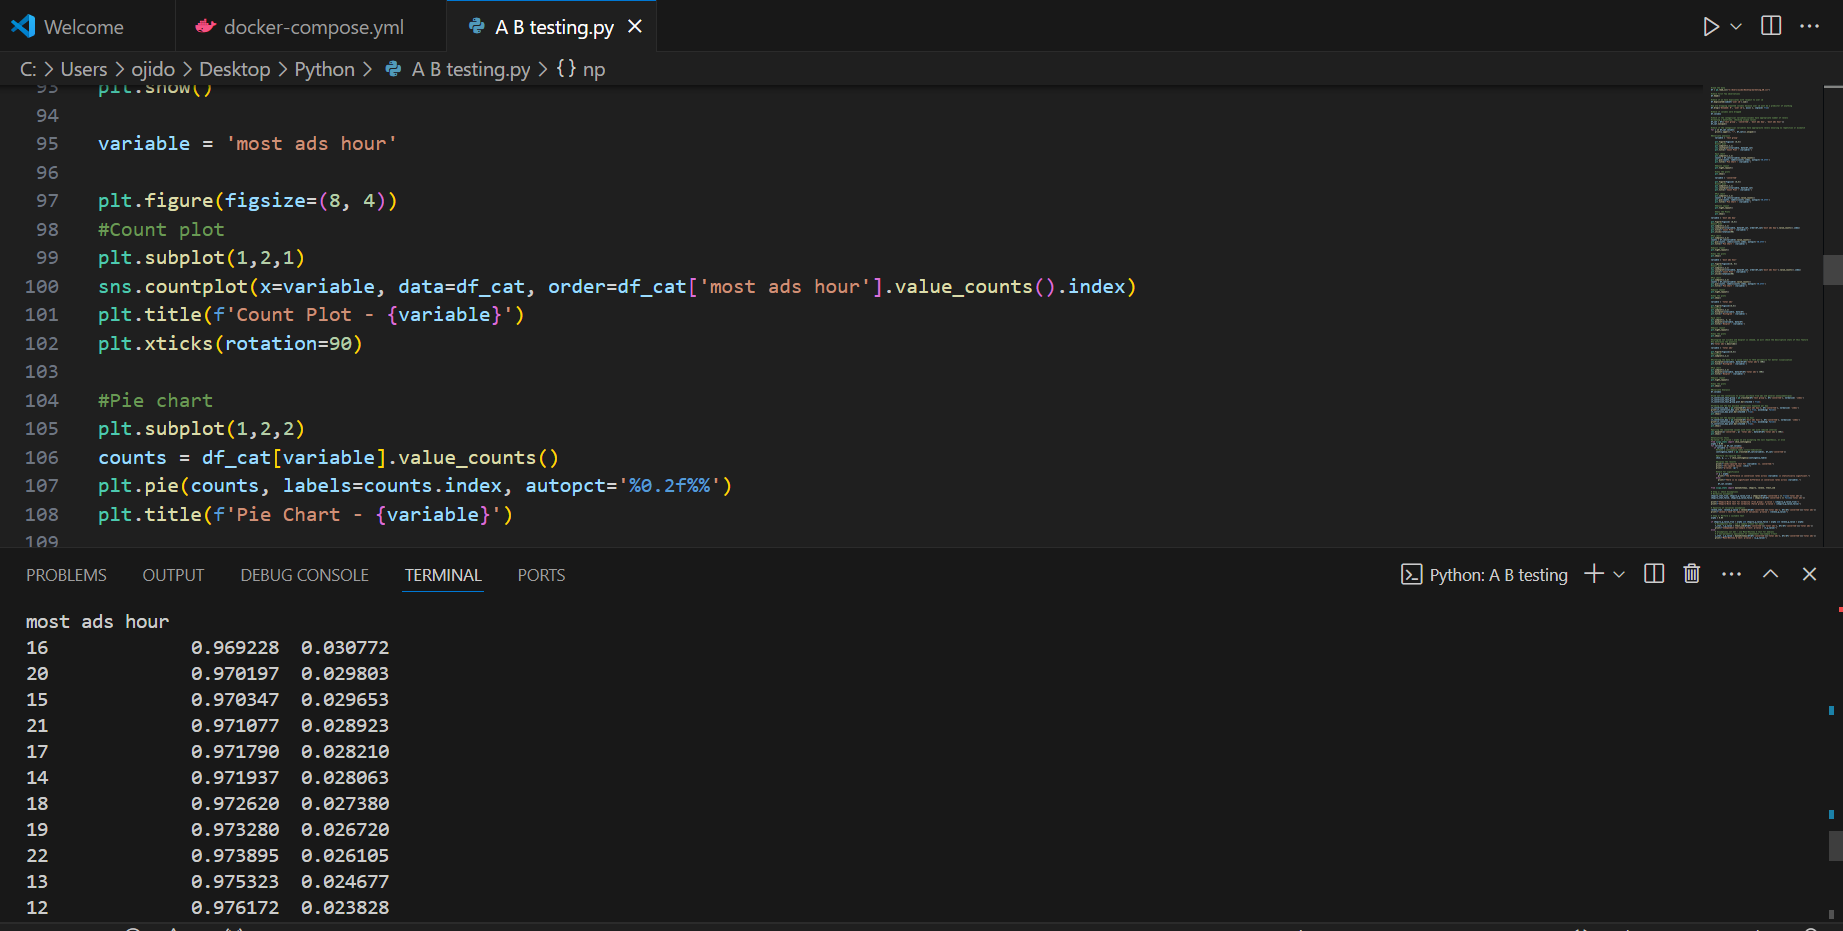
Fridays, Mondays, and Sundays see the most ad impressions, while peak ad display hours are 11 AM, 12 PM, and 1 PM.


Bivariate Analysis and Statistical Significance:
Focusing on the "converted" variable, the analysis reveals:
Conversion Rates: Ad exposure yields a higher conversion rate (2.5%) compared to PSAs (1.7%). Boxplots in the fourth image further illustrate this, with medians exceeding 25% for converted and 10% for non-converted.
Impact of Day and Hour: Conversion rates vary by day and hour. Focusing advertising efforts on days and hours with higher conversion rates could optimize campaign efficiency.
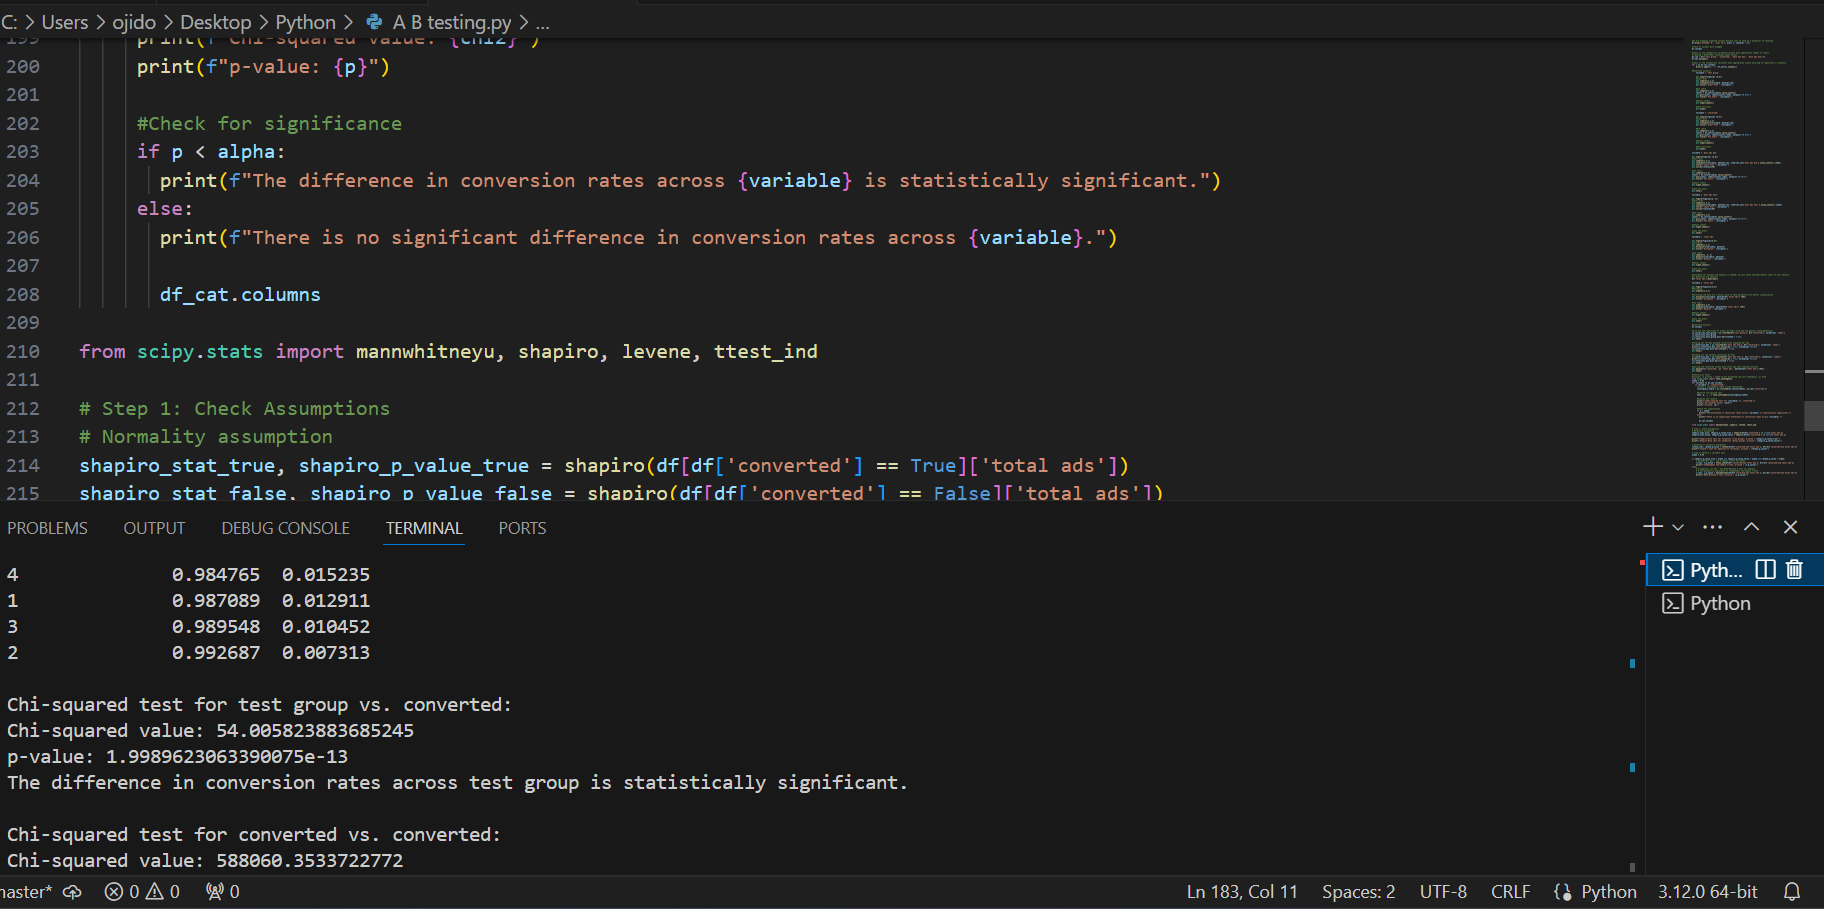
Statistical Significance: P-values < alpha in the fifth and sixth images indicate that Ads statistically influence conversions. Days and ad display hours also seem to be statistically significant factors.


Overall Project Interpretation: Statistical Analysis Summary:
Further statistical tests, including the Chi-Squared Test, Shapiro-Wilk Test, Levene's Test, and Mann-Whitney U Test, provide deeper insights into the campaign's effectiveness.
Key Findings:
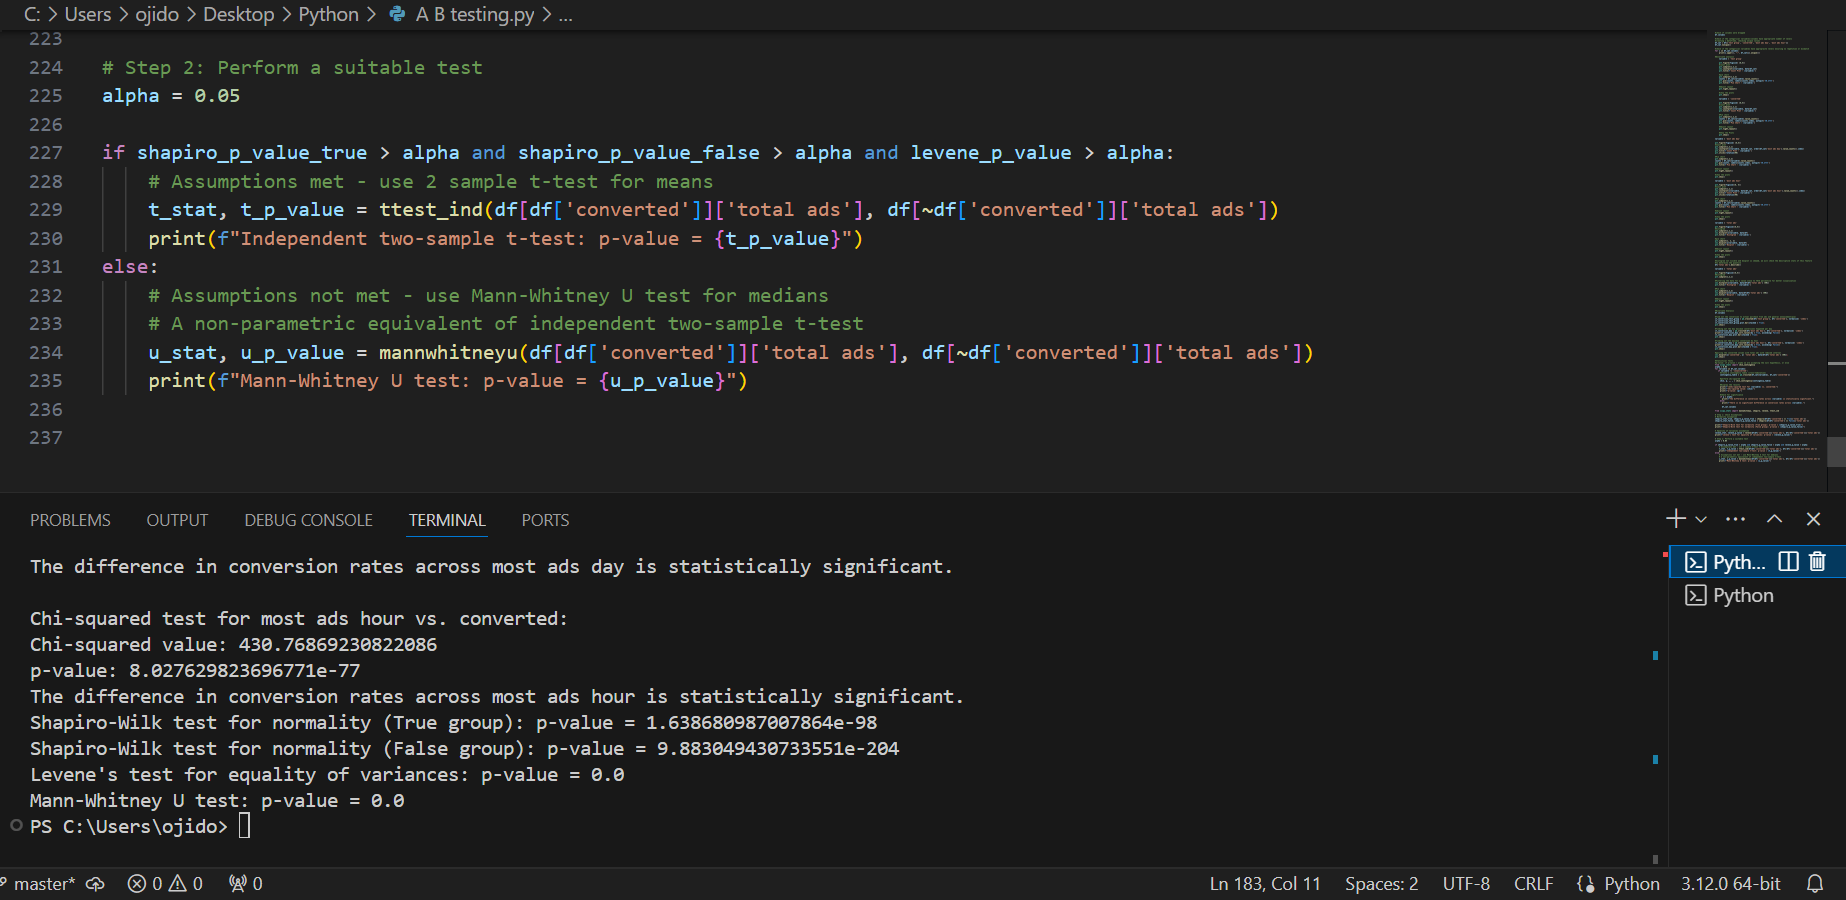
Most Ads Hour vs. Converted (Chi-Squared Test): A statistically significant association (p-value < 0.001) exists between the hour with the most ads displayed and conversion rates. This suggests that conversion rates vary significantly across different hours.
Normality of Data (Shapiro-Wilk Test): Neither the converted nor the non-converted groups follow a normal distribution (p-value < 0.001 for both). This finding informs the selection of appropriate statistical tests moving forward.
Equality of Variances (Levene's Test): The variances in total ad impressions are statistically different between converted and non-converted groups (p-value = 0.0). This also influences the choice of suitable statistical tests.
Distribution of Total Ads (Mann-Whitney U Test): There's a significant difference (p-value = 0.0) in the distribution of total ad impressions between converted and non-converted groups. This suggests that the number of times an ad is shown may play a role in conversion rates.
Overall Keypoints:
These statistical analyses reveal several key insights. The time of day ads are displayed, the normality of the data, and the variance in ad impressions all seem to be relevant factors influencing conversion rates.
Conclusion: Optimizing Ad Campaign Performance
The application of various statistical tests, including Chi-Squared, Shapiro-Wilk, Levene's, and Mann-Whitney U tests, yielded valuable insights for optimizing the advertising campaign's effectiveness.
Summary of Findings:
Chi-Squared Test: The timing (most ads hour) is significantly associated with conversion rates, indicating that the hour when the most ads are shown affects whether users convert.
Shapiro-Wilk Test: Neither the converted nor the not converted group data follows a normal distribution.
Levene's Test: The variances between the converted and not converted groups are significantly different.
Mann-Whitney U Test: There is a significant difference in the distribution of total ads between the converted and not converted groups.
Implications:
Significant Association: The strong association between the most ads hour and conversion rates suggests that the time of day when ads are shown is crucial for conversions. Adjusting ad schedules to optimize for conversion times could improve overall performance.
Non-Normality: Since the data is not normally distributed, parametric tests (like t-tests) are not suitable. Non-parametric tests (like the Mann-Whitney U test) are appropriate and indicate significant differences in ad distribution between groups.
Variance Difference: Different variances imply that the two groups (converted vs. not converted) behave differently regarding the number of ads they are shown or interact with.
In conclusion, These results highlight the importance of optimizing ad scheduling based on peak conversion times. Additionally, exploring the impact of ad frequency on conversions and tailoring strategies accordingly will further enhance campaign effectiveness
Advanced Techniques:
Beyond foundational libraries, this section explores the utilization of various Python packages:
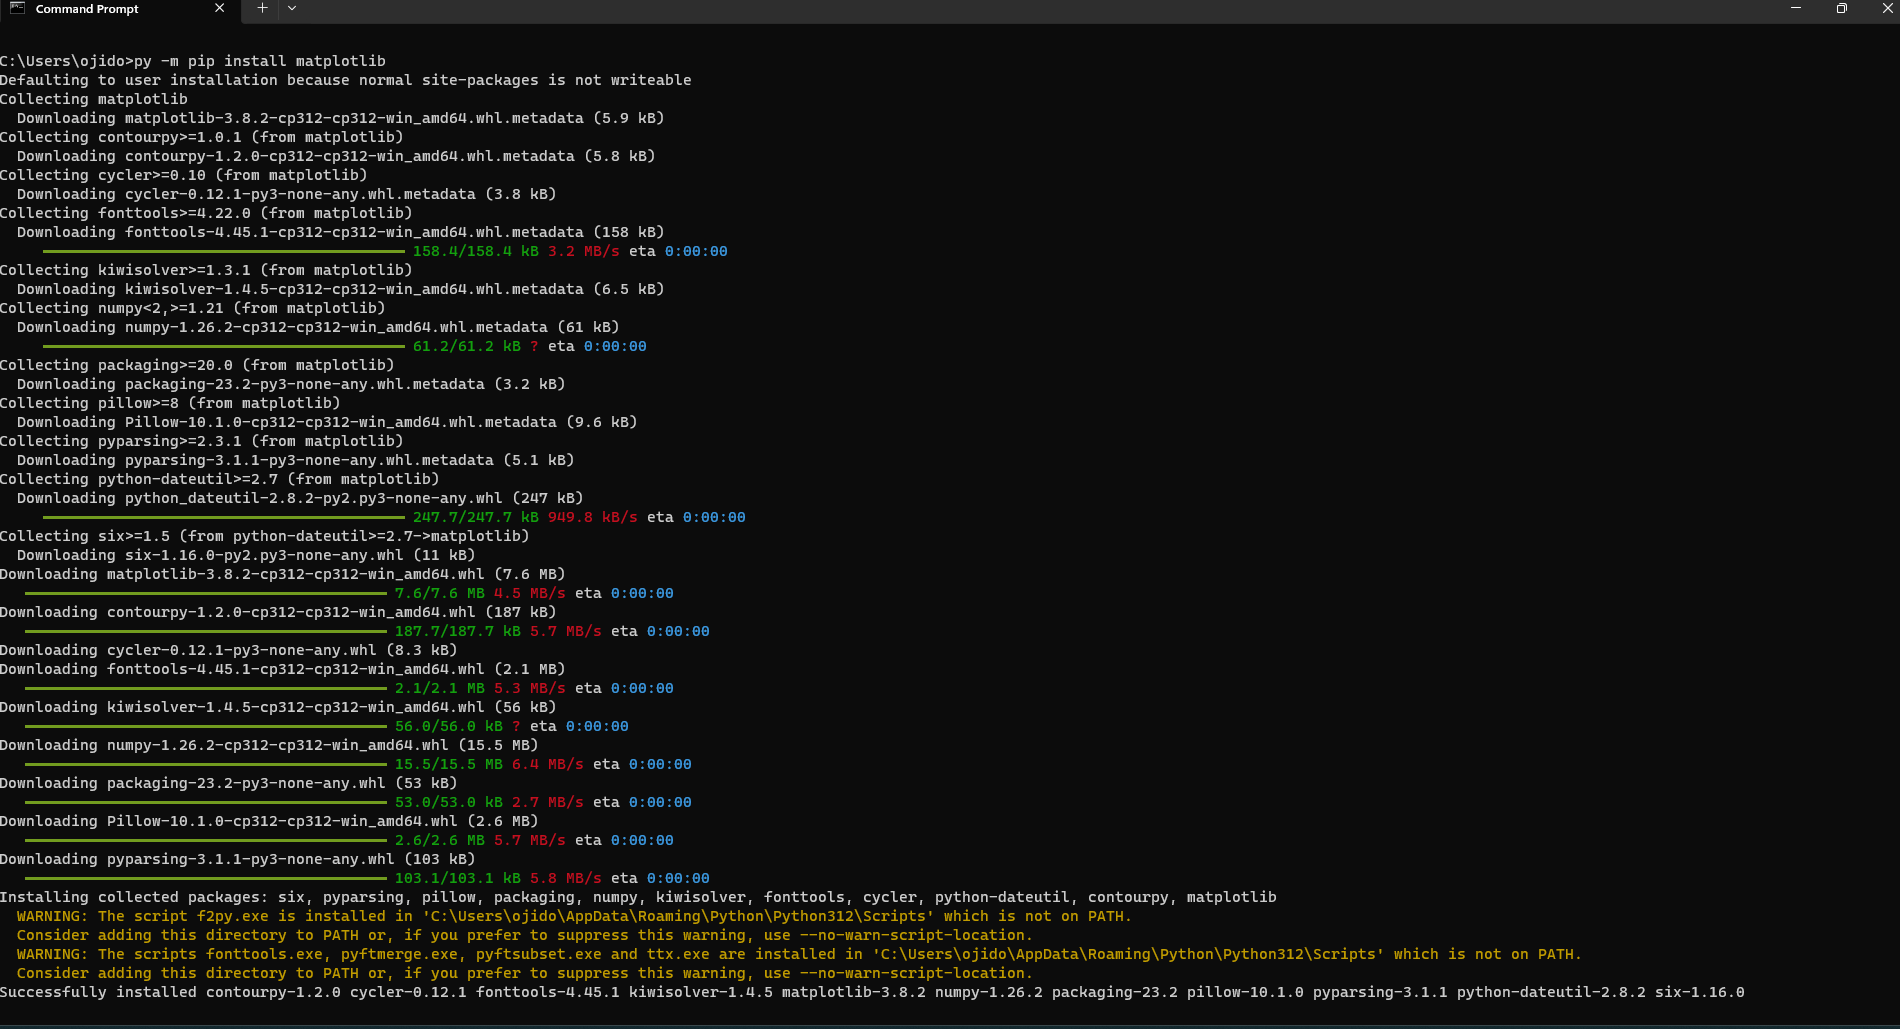
Package Installation: Code snippets demonstrate the installation process for essential libraries like Beautiful Soup, NumPy, Pandas, and Matplotlib using the command prompt on a local PC.
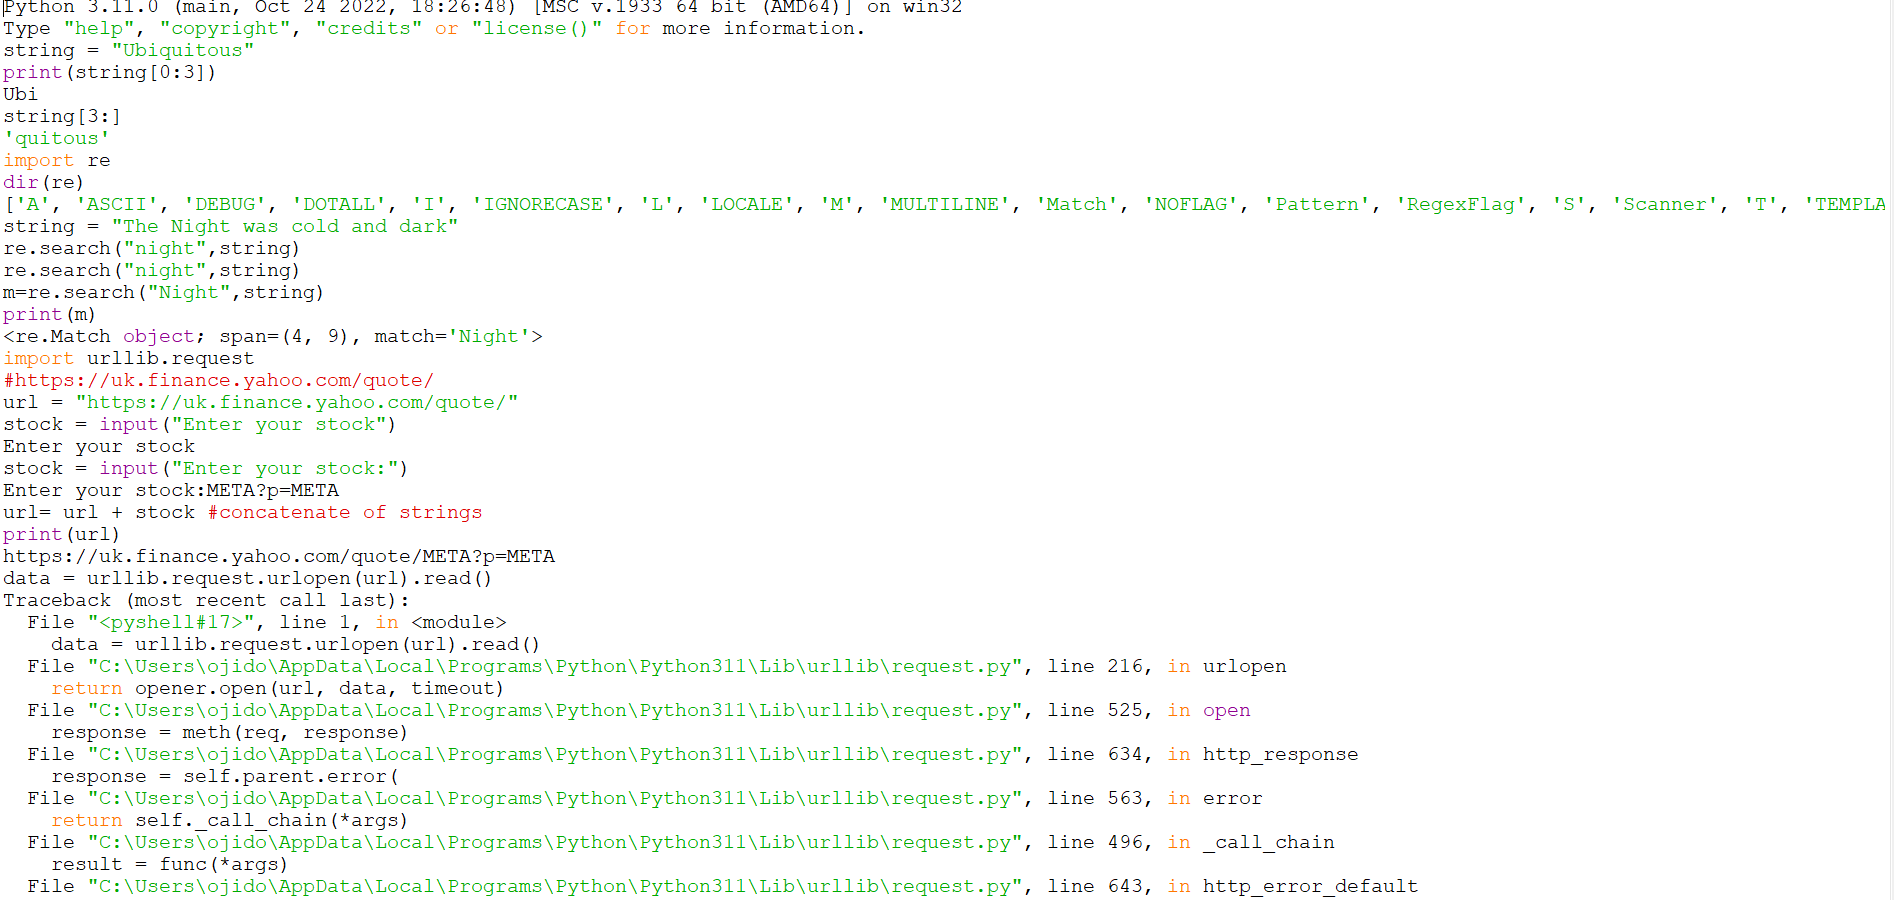
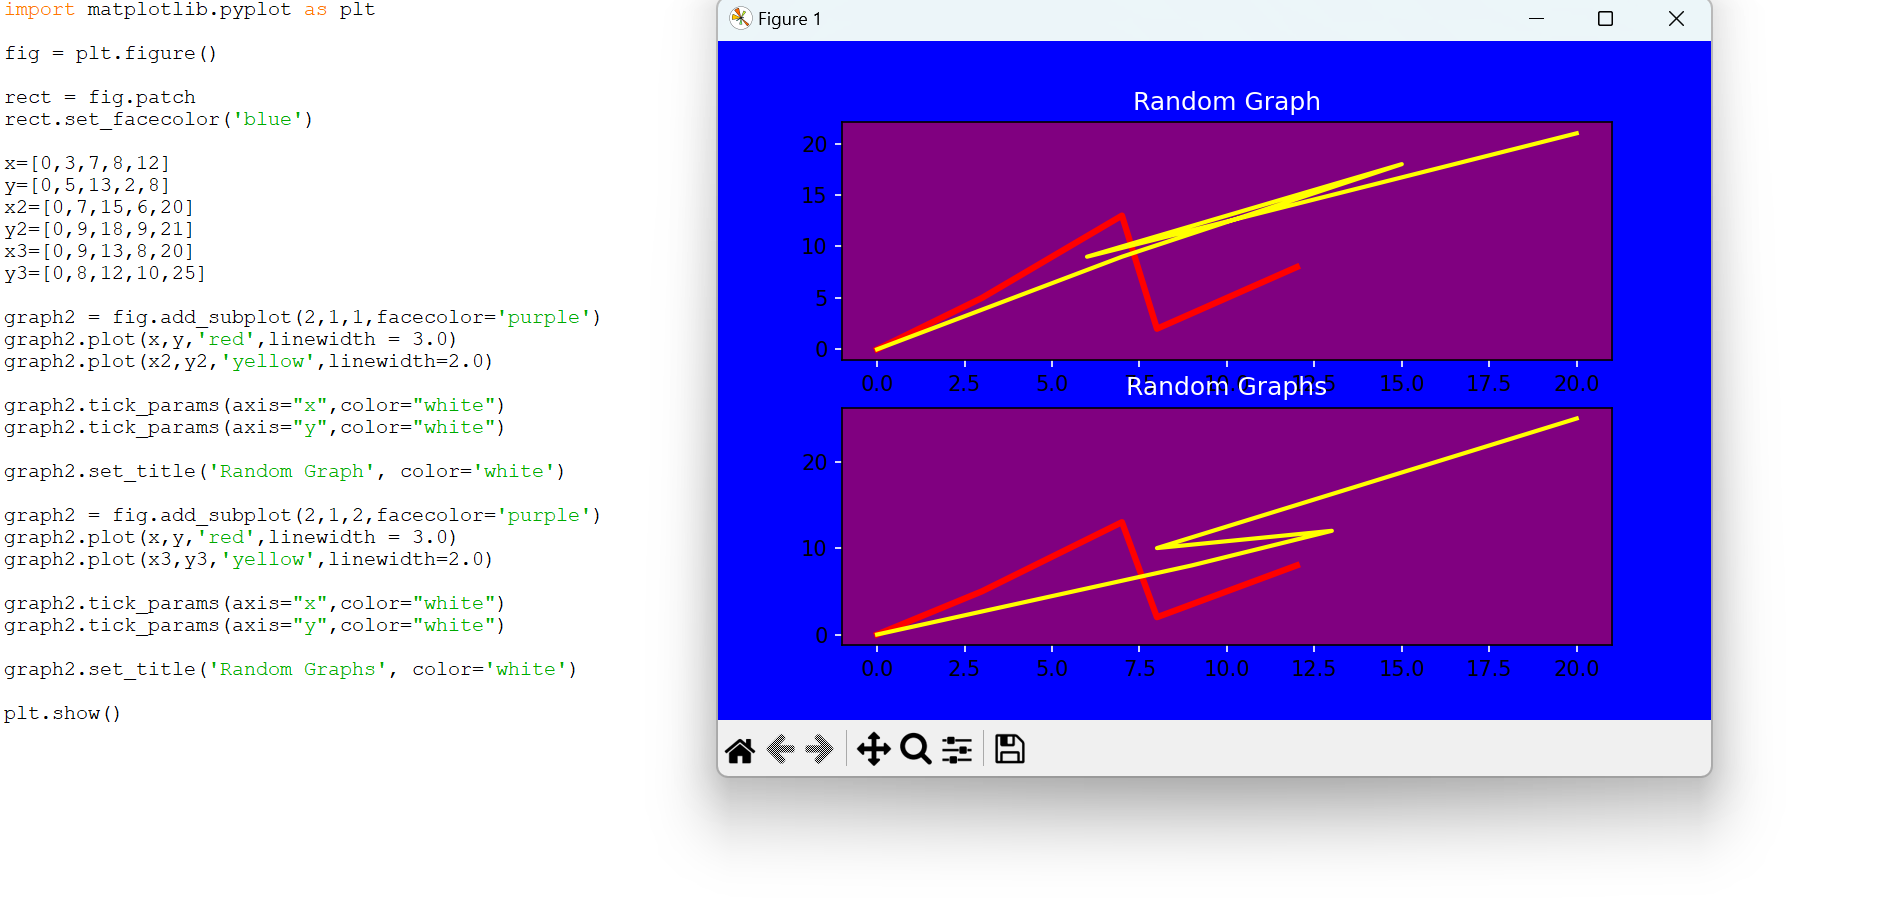
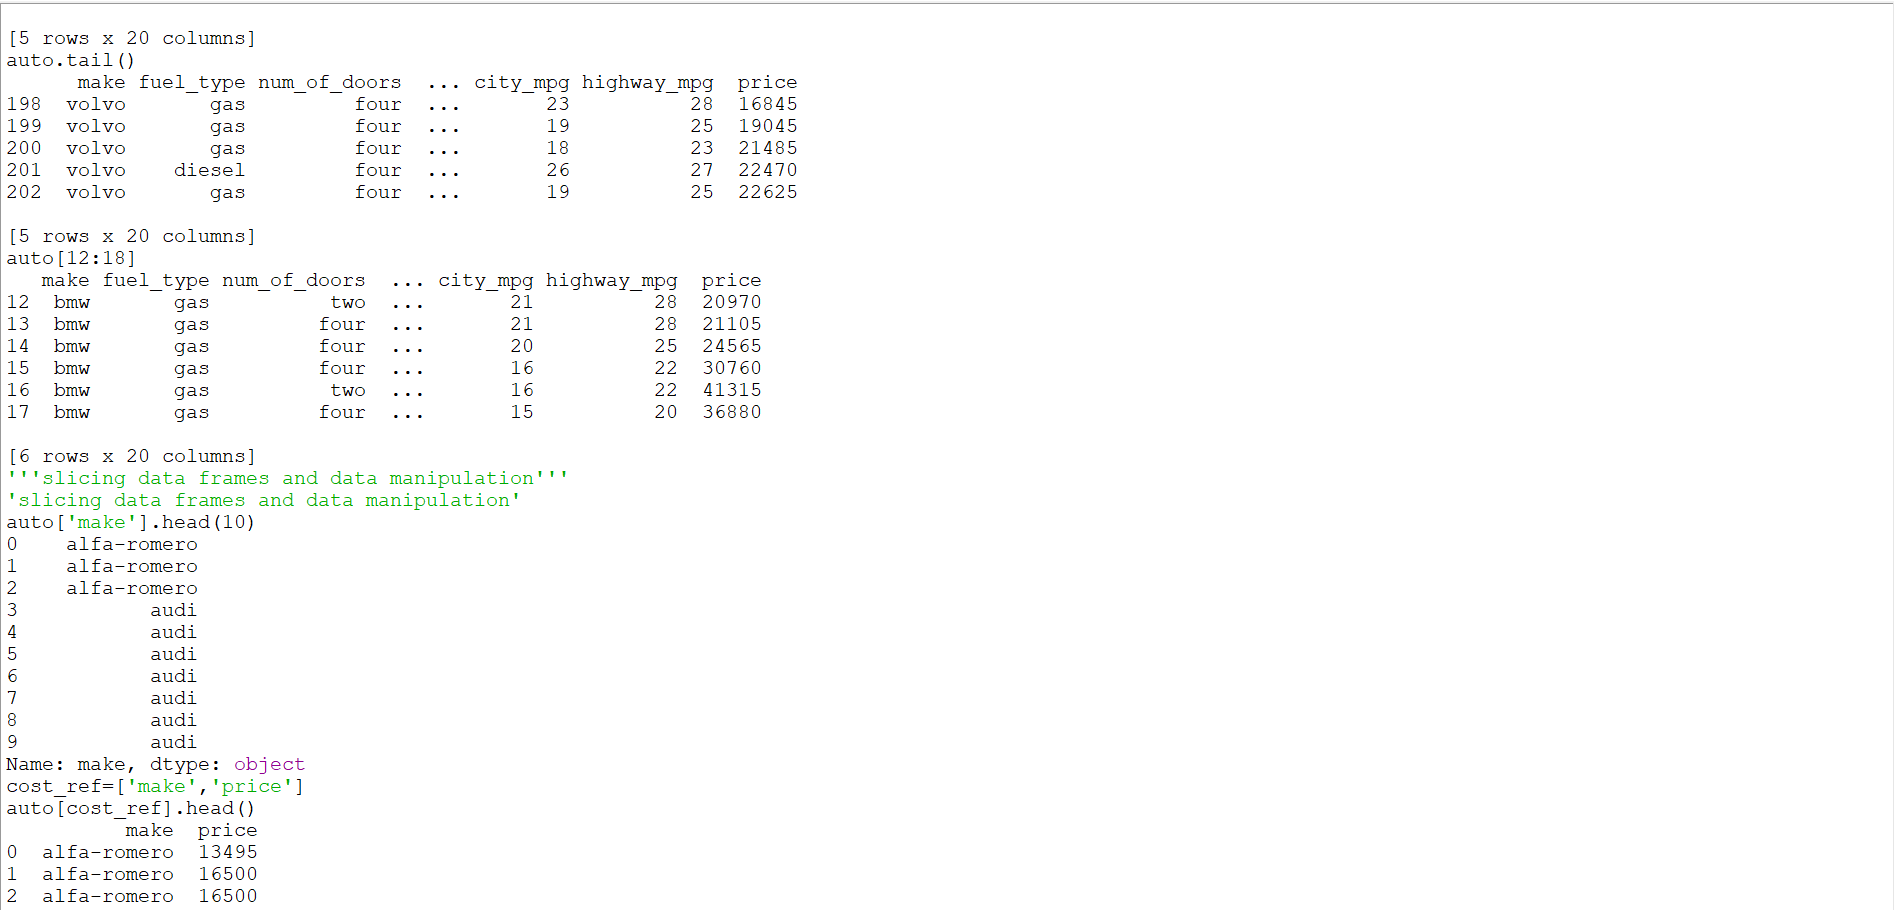
Interactive Coding: Examples showcase how to leverage these libraries within Python IDLE (Integrated Development and Learning Environment) for data manipulation, analysis, and visualization using Python 3.12 (64-bit).