
Power BI Deep Dive: Unveiling Stock Market Trends (2010-2013)
This project leverages the power of Power BI to conduct a comprehensive analysis of stock performance within the 2010-2013 timeframe. By employing advanced DAX formulas, we establish an interactive data model, empowering the exploration of key performance indicators and uncovering valuable insights into stock market trends.
Key Functionalities:
DAX Formula Mastery: We utilize DAX (Data Analysis Expressions) formulas to create calculated columns and measures within the Power BI model. These formulas unlock the ability to manipulate data, perform complex calculations, and derive meaningful metrics relevant to stock performance.
Interactive Model Construction: The data model is meticulously crafted to establish relationships between various data points (e.g., stock price, date) and ensure data integrity. This interactive model facilitates seamless analysis and exploration of stock performance across different timeframes.
Calculated Columns for In-Depth Analysis: Calculated columns are created using DAX to enrich the data model. These columns may include metrics like year-on-year growth percentages, allowing for a deeper understanding of stock price fluctuations over time.
Interactive Dashboard Design: An interactive dashboard is constructed within Power BI, providing a user-friendly interface for exploring the data. This dashboard may include interactive charts, slicers, and filters, enabling users to drill down into specific timeframes, compare stock performance, and identify emerging trends.
Report View
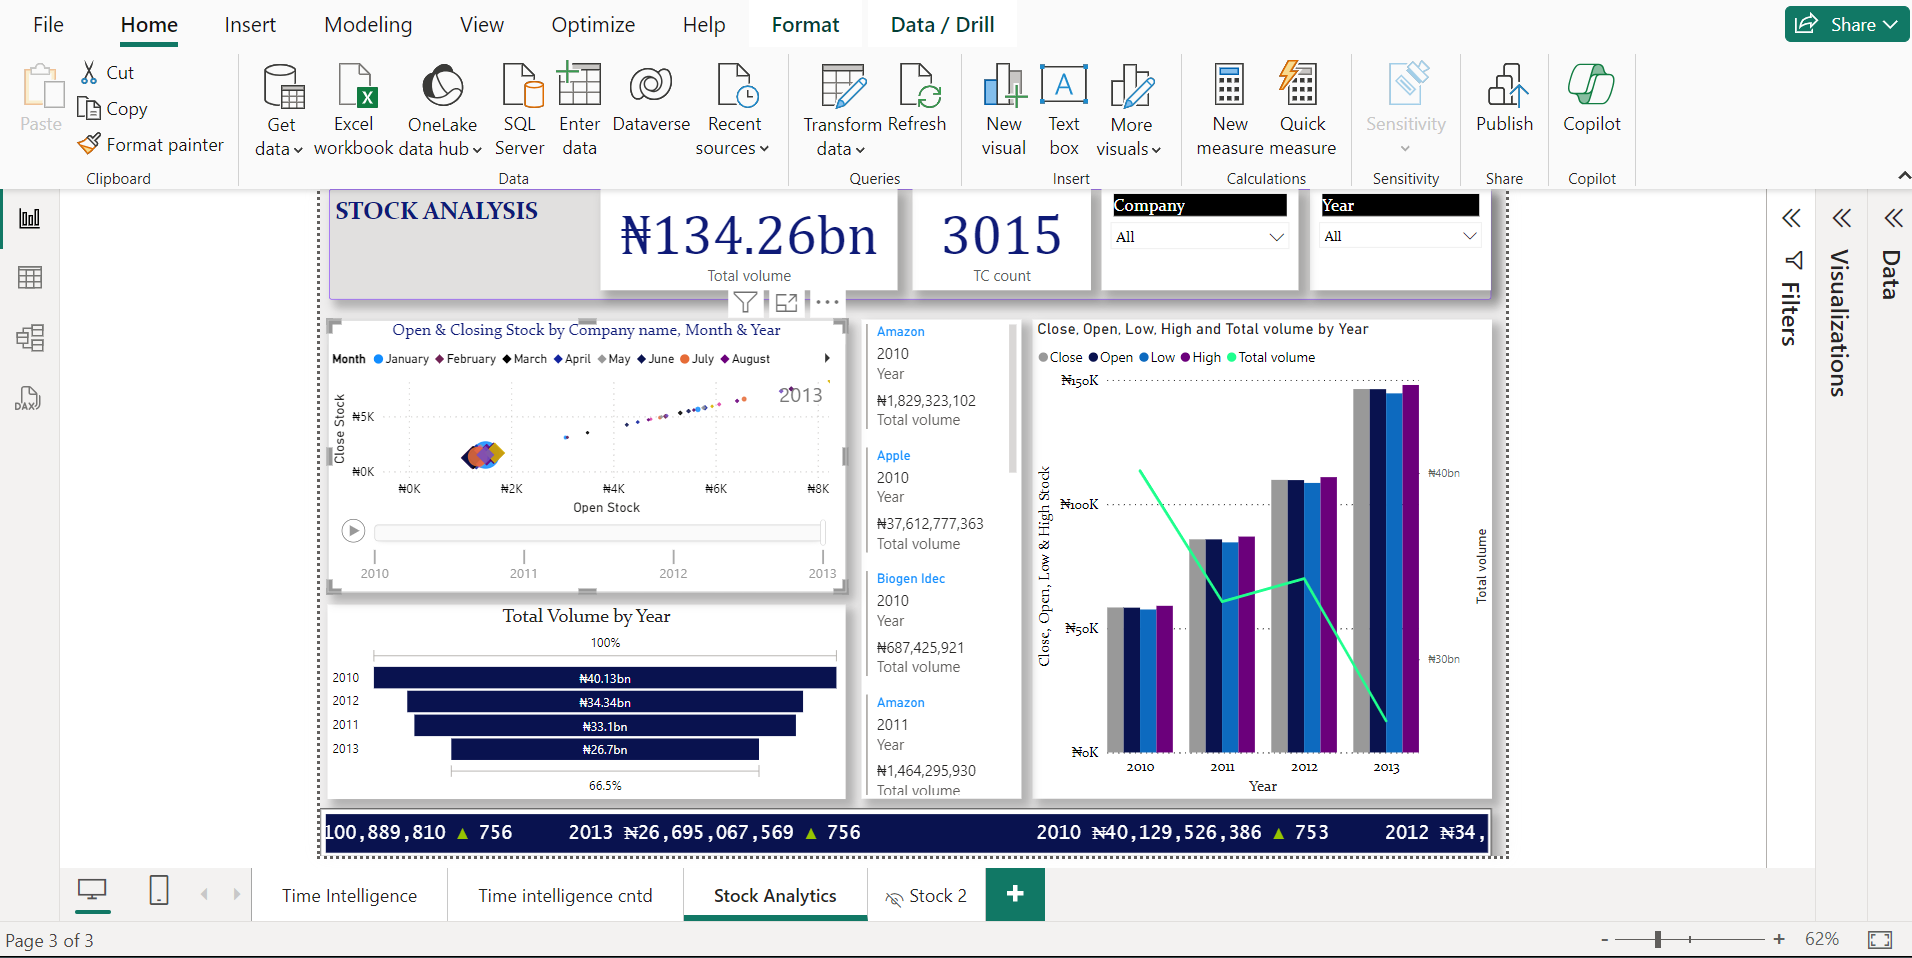
Unveiling the stock market dynamics: Identify top performers
This interactive Power BI dashboard provides a comprehensive view of individual stock performance. Key metrics like year-over-year and month-over-month growth percentages are readily available, facilitating in-depth analysis of price fluctuations and trend identification across the selected stocks. This allows us to leverage historical data for informed decision-making and potential future predictions
Table View
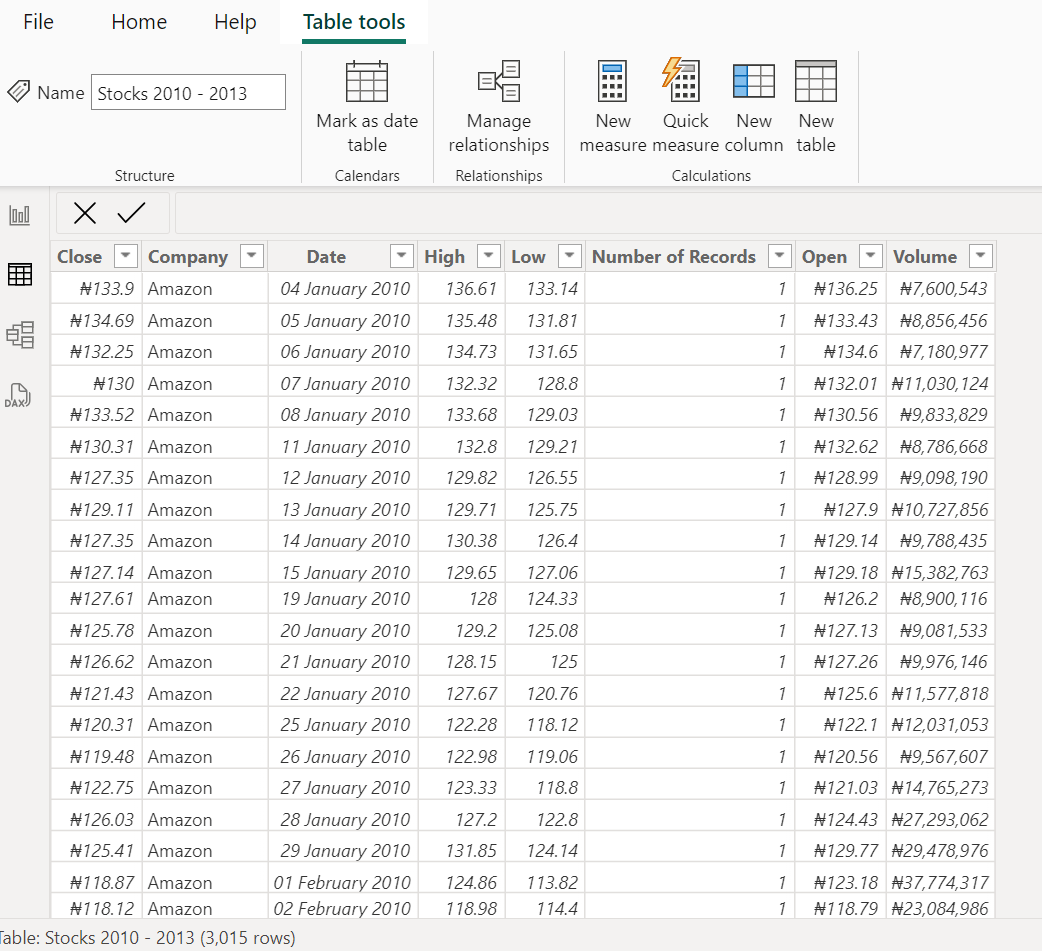
The table view provides a comprehensive overview of the data, including the various tables derived from the dataset. It displays the results of both simple calculated columns and those generated using advanced queries and functions.
Model View

Straightforward financial modeling techniques were employed to establish connections between the various data tables. This approach enhances the dashboard's interactivity, making it a more engaging tool for data exploration and presentation to stakeholders.
DAX Query View
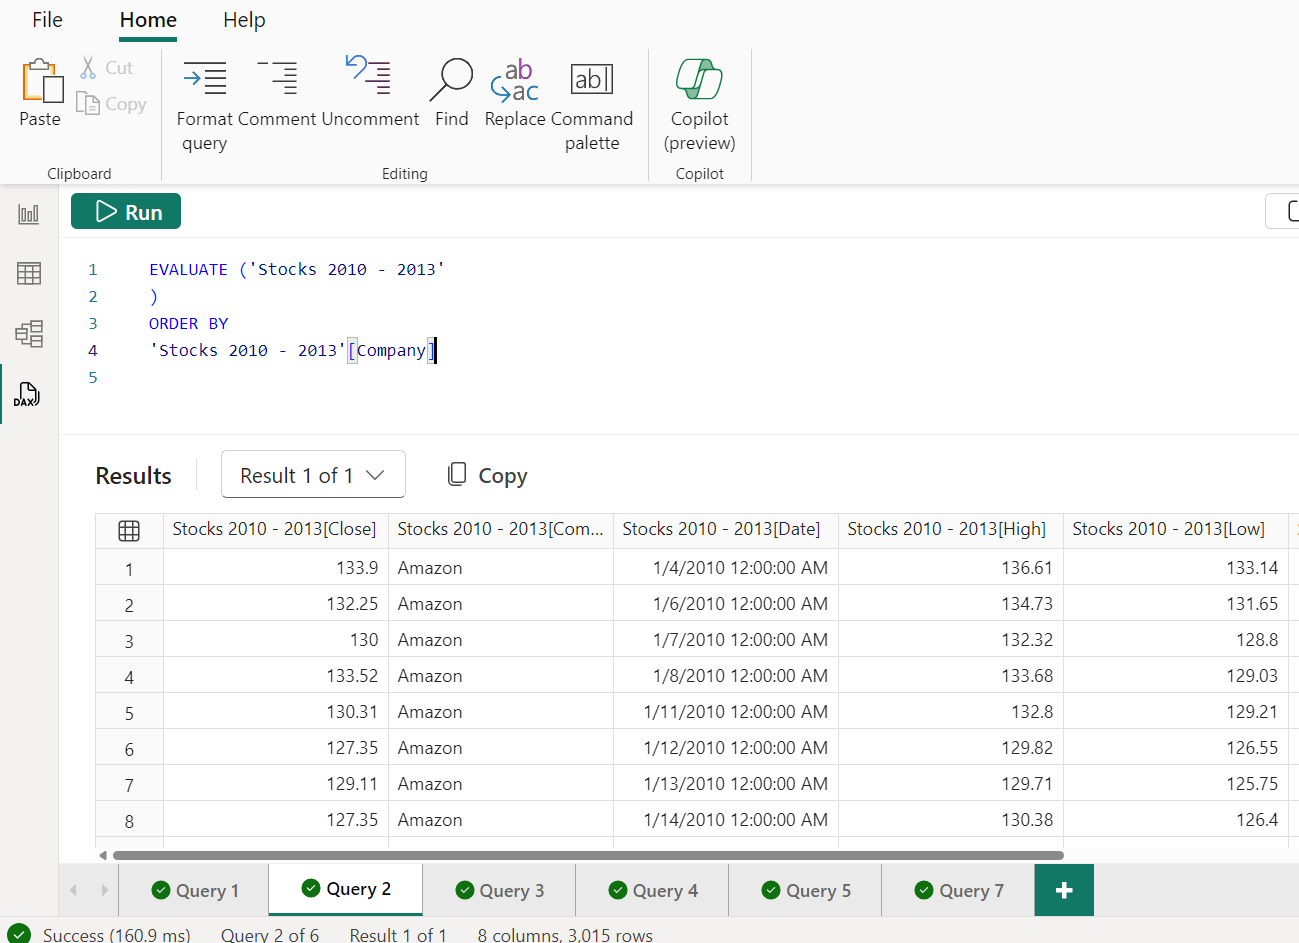
The DAX view also known as data analysis expressions; performs advanced calculations, queries, and functions, and helps to have deeper insights into existing expressions in this analysis.