
R Programming: Unveiling Deeper Customer Insights
Building upon the foundation laid by Excel and SQL, we delve into the realm of R programming to unlock even deeper customer insights from the massive bike-sharing dataset. R's power lies in its unparalleled capabilities for data manipulation, analysis, and visualization.
R's Impact on This Project:
By leveraging R's strengths, we were able to:
Unveil Key Customer Differences: Analyze ride frequency, ride duration, and identify the day of the week with the highest concentration of casual riders. This information is invaluable for targeted marketing campaigns aimed at converting casual riders to annual memberships.
Unlock Member Value: Quantify the cost savings and convenience benefits of annual memberships for frequent riders, providing data-driven insights to incentivize conversions.
Create Compelling Visualizations: Present findings in clear and concise tables and charts, facilitating communication of key insights to stakeholders.
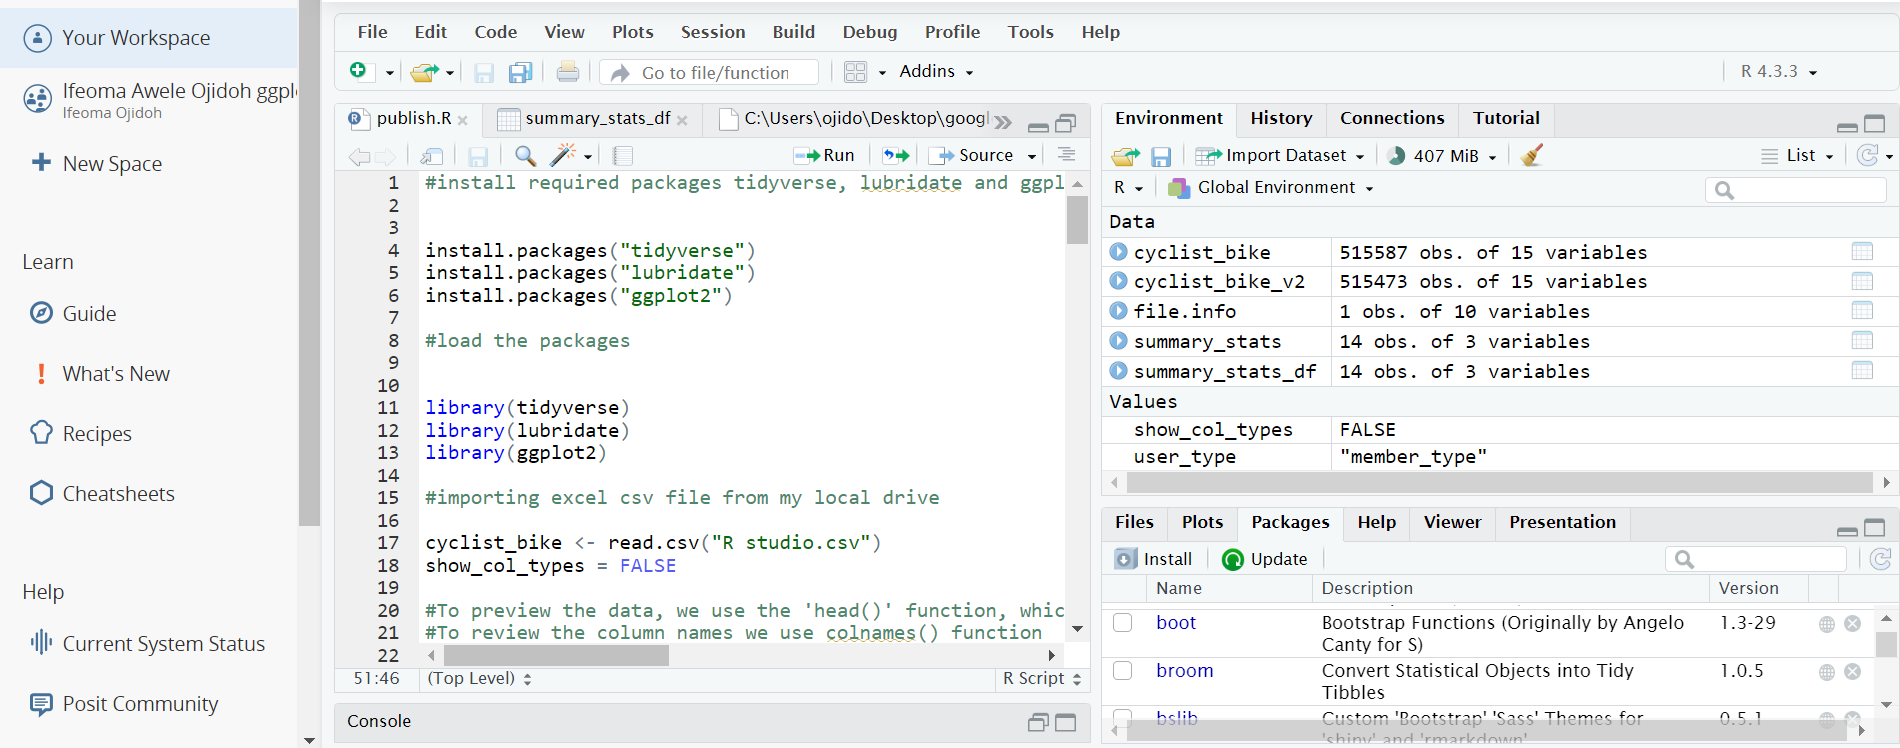
The image below shows the required packages installed and loaded to perform analysis in R
THE IMAGES BELOW SHOWS:
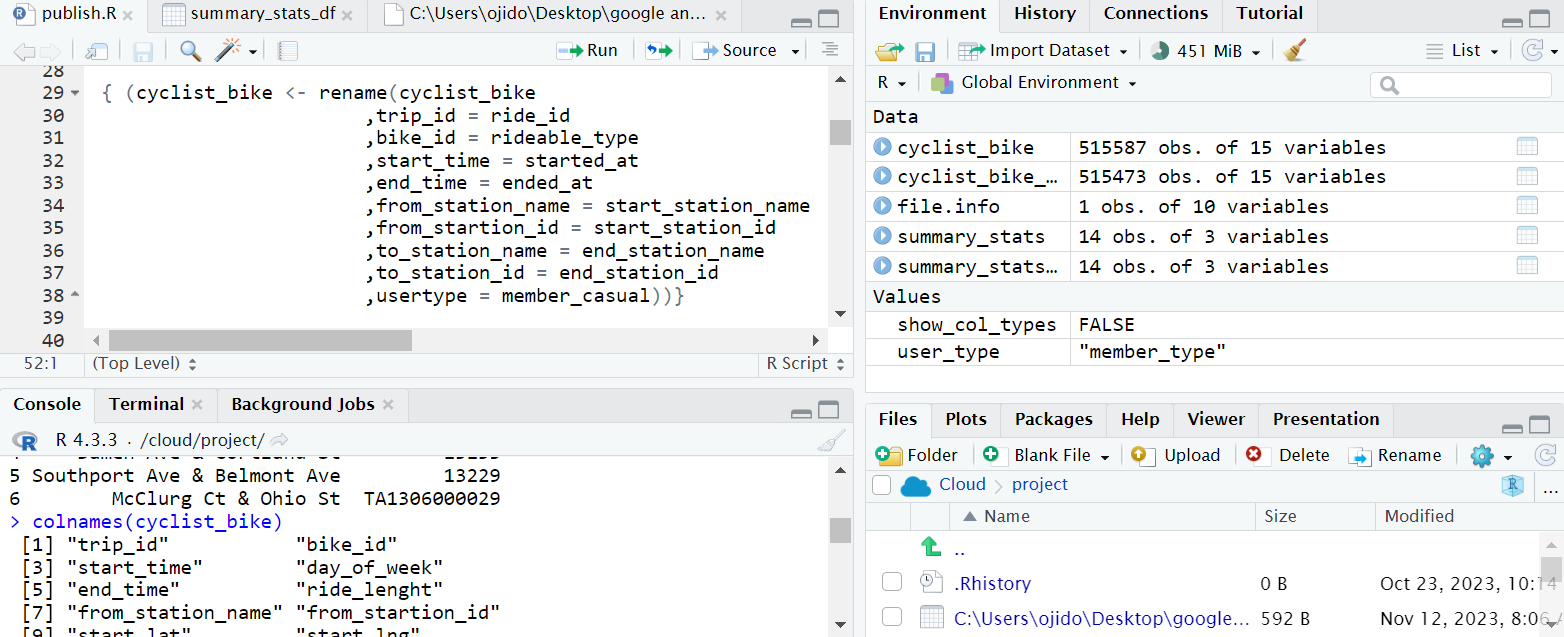
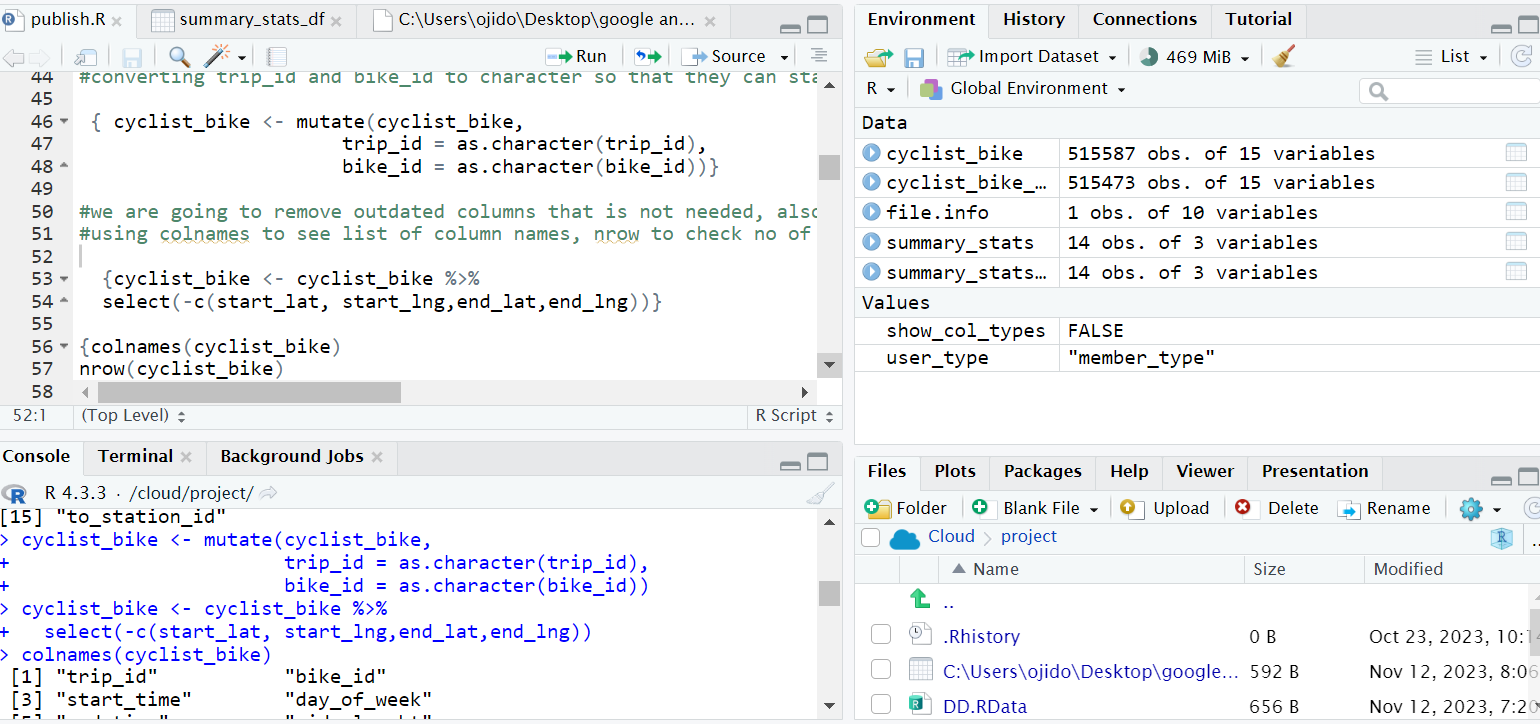
Column Renaming & Type Conversion: Streamlined data organization by renaming columns and converting select ones to character format using the mutate function. Unnecessary columns were removed to focus on relevant data for our analysis.
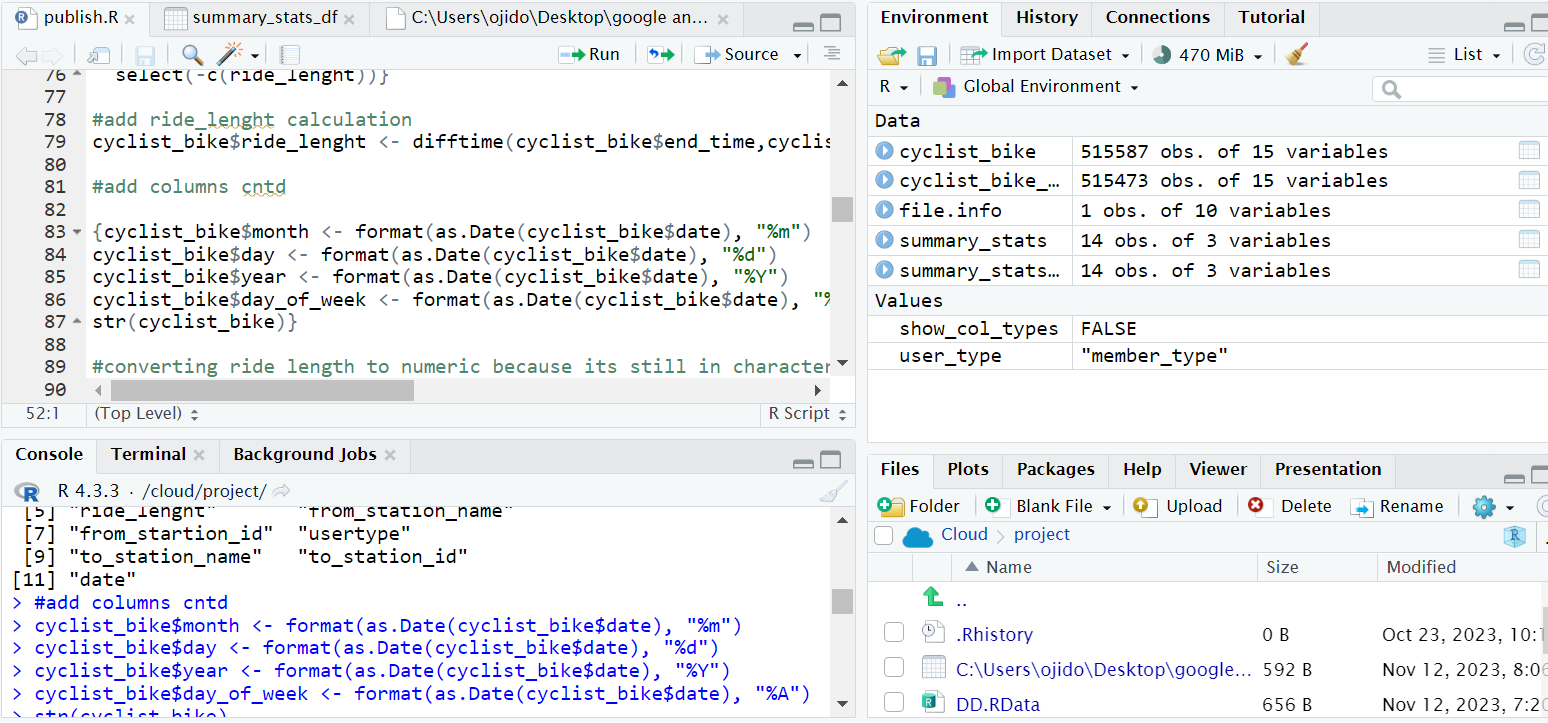
Calculated Date Difference: A new column was created using the difftime function, efficiently calculating the time difference between dates.
Character to Numeric Conversion: Data consistency was ensured by converting a character column(ride_lenght) to numeric format using a combination of is.factor and is.numeric functions.
New Data Frame Creation: A targeted data frame was created from the existing one, allowing for focused analysis of the most relevant data points.


THE IMAGES BELOW SHOWS:
Descriptive Statistics: Initial analysis using the summary function provided a comprehensive overview of the new data frame.
Day of Week Reformatting: Weekday data was meticulously rearranged to ensure a Sunday-first format, fostering consistency for further analysis.
Ride Duration Trends: A ggplot2 bar chart visualized the average ride duration across weekdays, highlighting potential user patterns.
Ride Frequency Distribution: Another ggplot2 bar chart exposed the number of rides per weekday, offering insights into user behaviour.


Conclusion of Cyclistic Bike Share Analysis
Our analysis revealed interesting insights into the behavior of casual riders compared to annual members.
Key Findings:
Casual Rider Engagement: Casual riders exhibit higher ride frequency and longer ride durations than annual members. This suggests they might be regular cyclists who utilize the service more frequently than members, potentially incurring higher overall costs.
Member Convenience: Interestingly, data showed a higher frequency of riders with the same start and end stations among members. This could indicate members use Cyclistic for predictable commutes, highlighting the convenience of picking up and dropping off bikes at any station.
Cost Optimization: Based on ride frequency, casual riders are likely to spend more than the annual membership fee. Converting these frequent riders to members would not only benefit them financially but also increase Cyclistic's revenue stream.
Targeted Marketing Opportunities: Thursdays, Saturdays, and Sundays see a surge in casual rider activity. This presents a valuable opportunity for targeted marketing campaigns aimed at these high-engagement days. Offering discounts or special promotions could incentivize casual riders to switch to memberships.
Actionable Insights:
Cost-Benefit Analysis: Developing a clear cost-benefit analysis would quantify the number of rides a casual rider needs to take to justify the membership fee. This information can be used for targeted messaging in marketing campaigns.
Segmented Marketing Campaigns: Leveraging insights on casual rider profiles (frequent Thursdays, and weekends) and motivations, Cyclistic can design targeted marketing messages and promotions. Weekend discounts or express conversion options could be highly effective.
Projecting Future Impact: Estimating the potential increase in members and revenue based on successful conversion campaigns would showcase the impact of these marketing efforts and provide valuable data for Cyclistic's future strategies.
By implementing these recommendations, Cyclistic can optimize its pricing strategy and marketing efforts to attract and convert frequent casual riders into loyal annual members, leading to increased customer satisfaction and revenue growth.
Limitations of R Programming
Steeper Learning Curve: Compared to SQL, R has a steeper learning curve, requiring more time and effort to master its syntax and functionalities.
Focus on Programming: R is a full-fledged programming language, and its strength lies in its flexibility. However, for users with limited programming experience, this can be a barrier to entry.
Integration with External Systems: While improving, R may require additional effort for integration with certain business intelligence or data warehousing solutions, compared to SQL's more seamless integration with database systems.